The pair will likely resume the bullish trend and possibly retest its weekly high at 1.3298.
Bullish View
- Buy the GBP/USD pair and set a take-profit at 1.3300.
- Add a stop-loss at 1.3100.
- Timeline: 1-2 days.
Bearish View
- Set a sell-stop at 1.3167 and a take-profit at 1.3100.
- Add a stop-loss at 1.3250.
The GBP/USD pair came under pressure even after the UK published strong consumer and producer price index data. It is trading at 1.3200, which is slightly below this week’s high of 1.3300. It is still about 1.50% above the lowest level this month.
UK Inflation Surges
Consumer and producer prices in the UK are surging and analysts expect that the situation will keep getting worse in the coming months.
According to the Office of National Statistics (ONS), the country’s headline inflation jumped from 5.5% in January to 6.2% in February. This was the highest the figure has been in more than 30 years. Worse, the jump of consumer prices was spread across the board. Food and energy prices were the main contributors.
The core CPI, which excludes the volatile food and energy prices, rose from 4.4% in January to 5.2% in February.
The same situation happened among companies as the producer price index (PPI) rose to multi-decade highs. The PPI input increased to 14.7% while the PPI output jumped to 10.1%.
Therefore, these numbers have left the BOE in a bind considering that it has already made three rate hikes. Just last week, it increased interest rates by 0.255 in a bid to slow inflation. The fear is that a more hawkish BOE will likely lead to a slowdown of the UK economy.
The next key movers for the pair will be the flash manufacturing and services PMI numbers from the UK and US. Analysts expect these numbers to show that the two sectors remained above 50, which is a sign that they expanded. However, they expect that the figures declined because of the rising cost of doing business. The pair will also react to the US jobless claims and durable goods order numbers.
GBP/USD Forecast
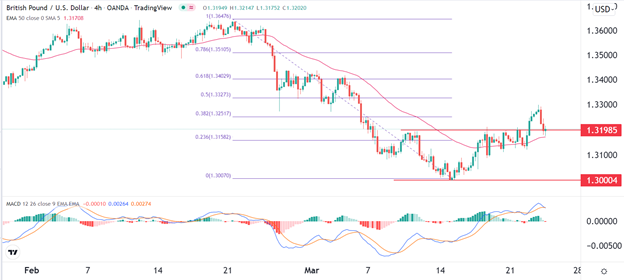
The GBP/USD pair declined after the strong UK inflation data. It moved from a weekly high of 1.3296 ti a low of 1.3200. On the four-hour chart, it managed to move below the 38.2% Fibonacci retracement level. It also dropped below the important support level at 1.3198, which was the highest level last week.
The pair remains slightly above the 25-day moving average while the MACD is still above the neutral level. The pair will likely resume the bullish trend and possibly retest its weekly high at 1.3298.

Source link