There is a likelihood that the pair will have a relief rally on Tuesday as the sell-off takes a breather.
Bullish View
- Buy the BTC/USD pair and set a take-profit at 40,000.
- Add a stop-loss at 36,000.
- Timeline: 1-2 days.
Bearish View
- Set a sell-stop at 37,500 and a take-profit at 36,000.
- Add a stop-loss at 39,000.
The BTC/USD pair remained under intense pressure amid the ongoing crisis in Ukraine. It is also having a difficult time as investors move to the safety of gold and the US dollar. It is trading at 38,750, which is a few points above the weekend low of 37,618.

Bitcoin Remains in Tight Range
The BTC/USD pair remained in a tight range in the past few weeks as the crisis in Ukraine has accelerated. In the same period, the US Dollar Index has jumped to the highest level in months while gold has crossed the key resistance at $2,000.
It seems like investors are getting more comfortable with gold and the US dollar during this crisis. At the same time, the performance of BTC and other cryptocurrencies has coincided with that of American stocks. Indeed, the Dow Jones and Nasdaq 100 indices dropped by hundreds of dollars on Monday.
Another reason why the BTC price has been under pressure is that the crisis has come at a time when inflation is surging. Recent data shows that American inflation has jumped to the highest point in over 40 years. With the prices of most items like oil, gas, wheat, fertilizer, and iron ore surging, there is a likelihood that inflation will soar to 10% in the coming months.
At the same time, the rising inflation is coming at a time when the labor market is tightening. Data published on Friday revealed that the unemployment rate dropped to 3.8% as the economy created over 600k jobs in February.
Therefore, these conditions are ripe for the Federal Reserve to start hiking interest rates. And there is a likelihood that the bank will hike at a faster pace than expected. If this happens, it could push investors away from risky assets.
BTC/USD Forecast
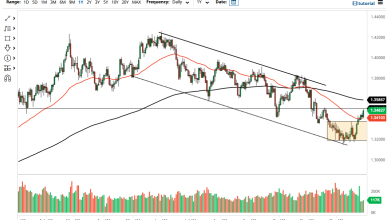
The four-hour chart shows that the BTC/USD pair has been under pressure in the past few days. The pair has managed to drop by about 15% from its highest level last week. It remains below the 25-day and 50-day moving averages. It is also along the middle line of the Bollinger Bands.
The BTC/USD pair is between the 50% and 61.8% Fibonacci retracement level. Therefore, there is a likelihood that the pair will have a relief rally on Tuesday as the sell-off takes a breather. If this happens, the next key resistance to watch will be at 40,000.

Source link