Spot natural gas prices (CFDS ON NATURAL GAS) stabilized on the rise during the recent trading at the intraday levels, to record slight daily losses until the moment of writing this report, by -0.22%. It settled at the price of $4.964 per million British thermal units, after rising yesterday’s trading by reaching 0.79%.

Natural gas prices trended much flatter on Monday, as production increased and forecasts showed light demand driven by weather forecasts across most US states, however futures closed in positive territory amid ongoing global supply pressures amplified by the Russian war in Ukraine.
Nymex gas futures for April settled at $4,900 per million British thermal units, an increase of 3.7 cents, to settle at $4,934.
The weather services company said the broad-based outlook showed generally mild conditions and “rather weak” domestic demand.
Meanwhile, production in the United States rose again to about 95 billion cubic feet on Monday, according to Bloomberg estimates, after hovering around 93 billion cubic feet for most of last week amid maintenance work and the lingering effects of freezing weather in early March.
Meanwhile, the Russian attack on Ukraine became more entrenched and bloodier over the weekend and into Monday. Ukrainian officials blamed Russian forces for a series of recent attacks on civilian targets and said the Kremlin had begun detaining and deporting residents of Mariupol, a devastated Ukrainian city, to remote parts of Russia.
US officials did not confirm the deportations during Monday’s trading. Ukrainian President Volodymyr Zelensky said Russia’s bombing of Mariupol had destroyed large swathes of the city. In comments posted on the Internet, he described the attacks as “terror that will remain in memory for centuries” and said there was no end in sight to the war.
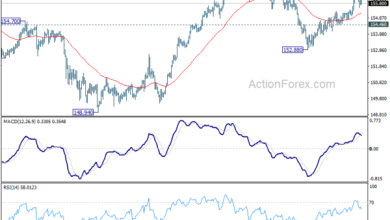
Technically, the price moves in a limited range of trading, to try to gain positive momentum that might help it breach the current resistance level 4.954. This is due to the dominance of the main bullish trend over the medium term along a slope line, with the positive support for its trades continuing above its simple moving average for the previous 50 days. As shown in the attached chart, (daily) we notice the influx of positive signals on the RSI indicators.
Our positive expectations are still in progress, especially if it breaches the resistance level 4.954, to confirm to us its intention to rise, targeting after that the resistance level 5.710.

Source link