We expect more rise for natural gas during its upcoming trading, especially in case it breaches the resistance 4.954.
Spot natural gas prices (CFDS ON NATURAL GAS) rose during the recent trading at the intraday levels, to achieve new daily gains until the moment of writing this report, by 1.38%. It settled at the price of $4.952 per million British thermal units, after rising during yesterday’s trading and for the second day on respectively, by 4.23%.
On Wednesday, natural gas futures posted a notable advance for the second consecutive session as Russia advanced in its invasion of Ukraine, fueling fears of an energy crisis that fueled a surge in commodity prices.
Nymex April gas futures rose 18.9 cents daily and settled at $4,762 per million British thermal units. The spot month was up 17 cents the day before. The May contract rose 18.9 cents on Wednesday to close at $4,787. Analysts have attributed the rise in gas futures prices to supply concerns stemming from the war, which also boosted European gas and oil prices.
Benchmark gas prices in Europe rose more than 30% in trading Wednesday, while Brent crude rose above $110 a barrel, a multi-year high.
US and European authorities have imposed severe sanctions on Russia since its invasion of Ukraine last week. European countries have placed restrictions on Russian shipping and a major pipeline awaits commissioning. Both affect Russia’s energy export capabilities.
As of Wednesday’s trading, the US has not directly targeted the Russian energy sector, given that Europe gets about a third of its natural gas from Russia. However, a White House spokesman said in televised statements that oil and gas sanctions are on the table.
Meanwhile, the Natural Gas Storage report released by the Energy Information Administration on Thursday may add more positive momentum. After polls showed a broad expectation of a three-digit withdrawal, reflecting strong late-winter demand for the week ending February 25.
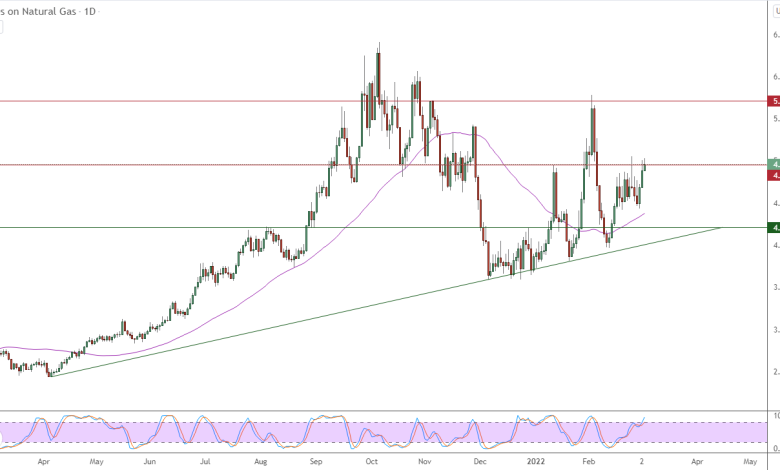
Technically, the rise of natural gas comes amid its trading along a major bullish slope line in the medium term, as shown in the attached chart for a (daily) period. It is supported by its continuous trading above its simple moving average for the previous 50 days, in addition to the influx of positive signals on the relative strength indicators. Despite from reaching overbought areas, the price attacked the current resistance level 4.954 with its recent rise.
Therefore, we expect more rise for natural gas during its upcoming trading, especially in case it breaches the resistance 4.954, to target the resistance level 5.710 after that.

Source link