The pair will likely continue dropping as bears target the next key support level at 1.3450.
Bearish View
- Sell the GBP/USD pair and set a take-profit at 1.3445.
- Add a stop-loss at 1.3600.
- Timeline: 1 day.
Bullish View
- Set a buy-stop at 1.3540 and a take-profit at 1.3600.
- Add a stop-loss at 1.3480.
The GBP/USD pair retreated slightly on Monday as investors continued to reflect on the recent interest rate decision by the Bank of England. It is trading at 1.3527, which is about 0.75% below its highest level last week.
BOE and Fed
The main catalyst for the GBP/USD pair is the fact that the Fed and the Bank of England have now embraced a hawkish tone and are completely data dependent.
Last week, the BOE decided to raise interest rates by 0.25%, bringing them to 0.50%. It was the first time since 2004 that the bank implemented back-to-back rate hikes. It also hinted that it will end its asset purchases program.
The BOE will likely continue hiking interest rates considering that the housing market continues to strengthen. Data published by Halifax showed that home prices continued rising in January.
The Fed, on the other hand, has hinted that the it will end its asset purchases program in March and then start a hiking phase. The bank hinted that it will implement three rate hikes although some analysts are pricing in four to seven hikes.
The fact that the Fed will deliver more hikes was supported by the performance of the labor market. Last week, the Bureau of Labor Statistics said that the American economy created more than 467k jobs in January and upgraded December’s jobs numbers.
The next major catalyst for the GBP/USD pair will be the upcoming American consumer price index (CPI) data. Analysts expect the data will show that the country’s inflation jumped to he highest level in more than 40 years in January.
Inflation is expected to remain at elevated levels especially as the threat of war between Ukraine and Russia escalates. On the positive side, there are signs that supply chain challenges are easing, which will lower price pressures.
GBP/USD Forecast
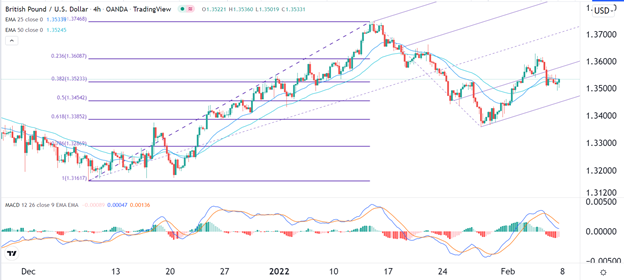
The four-hour chart shows the pair rose to a high of 1.3630 last week. It is now trading at 1.3535, which is slightly below the first support of the Andrews pitchfork tool. It has also moved to the 38.2% Fibonacci retracement level and below the 25-day moving average. The MACD has also made a bearish crossover pattern.
Therefore, the pair will likely continue dropping as bears target the next key support level at 1.3450. This view will be invalidated if it moves above the resistance at 1.3570.

Source link