A more bearish signal will happen when the pair moves below the support at 1.3495.
Bearish View
- Set a sell-stop at 1.3495 and a take-profit at 1.3400.
- Add a stop-loss at 1.3560.
- Timeline: 1-2 days.
Bullish View
- Set a buy-stop at 1.3545 and a take-profit at 1.3600.
- Add a stop-loss at 1.3480.
The GBP/USD pair wavered in the evening session as investors reacted to the good news from Russia and as traders waited for the upcoming UK inflation data. It is trading at 1.3535, which is a few points above Monday’s low of 1.3486.
UK Inflation Data Ahead
On Tuesday, the UK published relatively strong jobs numbers. According to the Office of National Statistics, the country’s unemployment rate held steady at about 4.1% in December. That rate is slightly above where it was before the pandemic started. Redundancies have fallen while wage growth has done well.
On Wednesday, the ONS will publish another important economic number that will provide hints about the Bank of England (BOE). Economists expect the data to show that the headline CPI declined from 0.5% in December to -0.2% in January. On a year-on-year basis, the data is expected to show that the CPI held steady above 5.4%.
Meanwhile, analysts believe that the core CPI declined to -0.4% on a MoM basis and then rose slightly to 4.3% on a YoY basis.
Analysts expect that the BOE will deliver a few more hikes this year. According to ING, most analysts see the bank delivering about 6 hikes. However, in their assessment, they see the BOE implementing about 3 hikes this year.
The next key catalyst for the GBP/USD pair will be the American retail sales numbers. Despite the rising prices, analysts are upbeat about sales. For example, the median estimate is that sales rose to 2.0% in January after falling by 1.9% in the previous month. They also see the core retail sales rising to 0.8%. The US will also publish the latest industrial and manufacturing production data.
GBP/USD Forecast
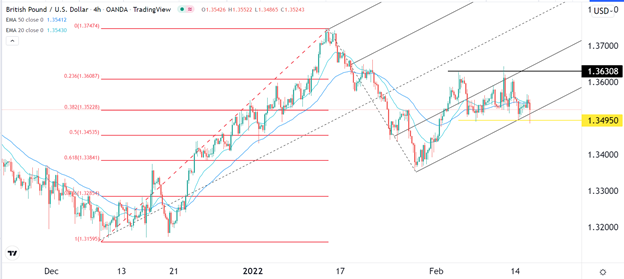
The GBP/USD pair declined to a low of 1.3485 on Tuesday and then pared the losses to 1.3525. On the four-hour chart, the pair managed to move below the lower side of Andrew’s pitchfork and the 38.2% Fibonacci retracement level.
It also moved below the 25-day and 50-day exponential moving averages while the MACD has moved slightly below the neutral level. It is also slightly above the yellow support line.
Therefore, a more bearish signal will happen when the pair moves below the support at 1.3495. If this happens, the next point to watch will be at the 50% retracement at 1.3435.

Source link