Our expectations suggest a return to the index’s decline during its upcoming trading.
The Dow Jones Industrial Average rose again during its recent trading at the intraday levels, to achieve gains in its last sessions. It erased the losses of the previous session by 1.79%, to add the index to it about 596.40 points. It then settled at the end of trading at the level of 33,891.36, after it declined during Tuesday’s trading with a rate of -1.76%.

All 30 components of the index rose except for Visa Inc. Only Cl A closed in the red, and the top percentage gainer was Caterpillar Inc. by 5.35%, and Intel Corp. by 4.38%, followed by Dow Inc. by 3.62%.
The market has seen great volatility as investors see risks to economic growth, conflict in Russia and central bank rate hikes that cannot be predicted with certainty yet. We saw a choppy sharp bearish pattern for one day, followed by longs on the dips the next day.
Meanwhile, Federal Reserve Chairman Jerome Powell headed to Capitol Hill to testify before the House Financial Services Committee. He told lawmakers he’s leaning toward a quarter-point rate hike in March to cool inflation, but the Ukraine war is spoiling expectations about interest rate changes.
Separately on the economic data front, the ADP automated payroll processor said the private sector added 475,000 new jobs in February after omicron mutation fears faded, governments eased pandemic restrictions and the economy rebounded. Economists surveyed by the Wall Street Journal expected an increase of 400,000 jobs.
The Fed’s Beige Book survey of economic activity also showed a modest expansion in the final weeks of last year, due to continued supply chain disruptions and labor shortages, but also a downturn in leisure travel due to the omicron mutant.
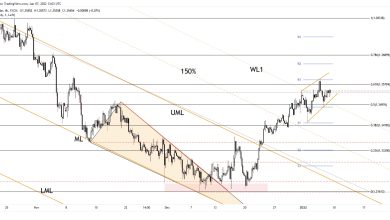
Technically, the index’s rise came amid the influx of positive signals on the relative strength indicators, after reaching earlier oversold areas, to attempt to discharge this oversold rate, and to retest the main resistance level 34,000 once again.
Despite this strong ascent, it continues to suffer from negative pressure from its continuous trading below its simple moving average for the previous 50 days. It is under the control of a bearish corrective wave in the short term, and it was affected by the breaking of a minor ascending trend line earlier, as shown in the attached chart for a period of time. (daily).
Therefore, our expectations suggest a return to the index’s decline during its upcoming trading, as long as the resistance level 34,000 remains, to target again the support level 33,272.

Source link