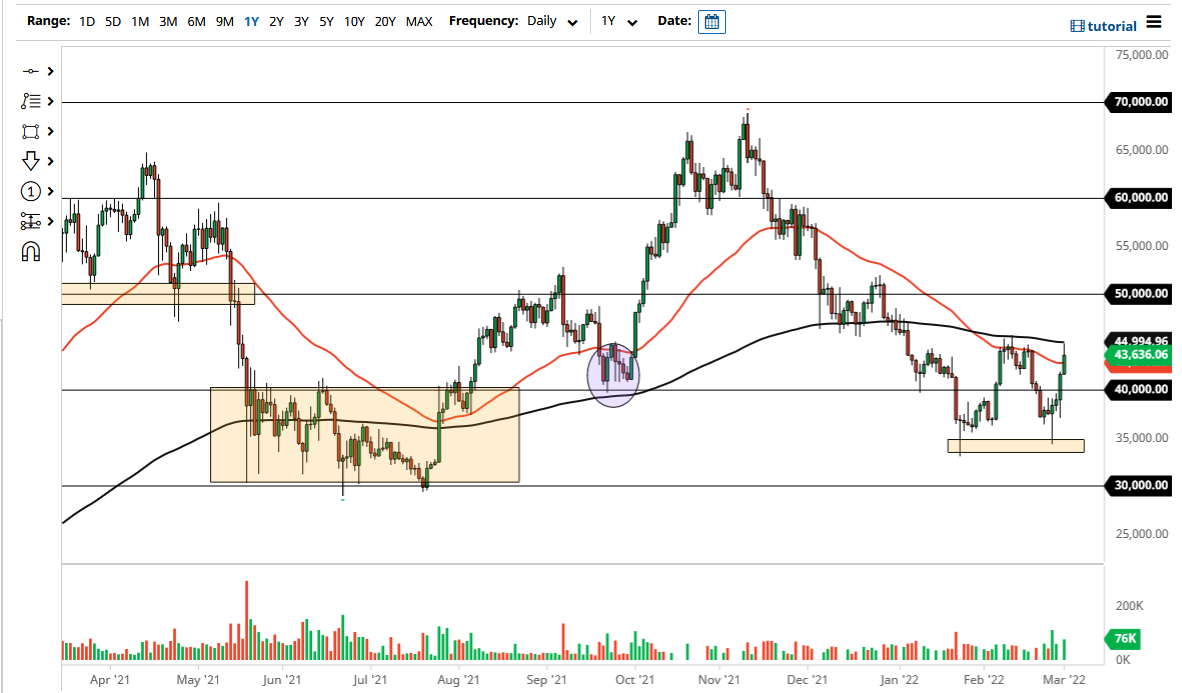
BTC/USD Forex Signal: Recovery Continues Above $42,896

However, the price is approaching long-term resistance at $45,668.
Previous BTC/USD Signal
My previous signal last Thursday produced a losing short trade from the bearish reversal at the resistance level I had identified at $35,583.
Today’s BTC/USD Signals
Risk 0.50% per trade.
Trades may be entered before 5pm Tokyo time Thursday.
Long Trade Ideas
- Long entry after a bullish price action reversal on the H1 timeframe following the next touch of $42,896, $40,567, or $37,179.
- Put the stop loss $100 below the local swing low.
- Move the stop loss to break even once the trade is $100 in profit by price.
- Remove 50% of the position as profit when the trade is $100 in profit by price and leave the remainder of the position to ride.
Short Trade Ideas
- Short entry after a bearish price action reversal on the H1 timeframe following the next touch of $45,668 or $48,555.
- Put the stop loss $100 above the local swing high.
- Move the stop loss to break even once the trade is $100 in profit by price.
- Remove 50% of the position as profit when the trade is $100 in profit by price and leave the remainder of the position to ride.
The best method to identify a classic “price action reversal” is for an hourly candle to close, such as a pin bar, a doji, an outside or even just an engulfing candle with a higher close. You can exploit these levels or zones by watching the price action that occurs at the given levels.
BTC/USD Analysis
I wrote last Thursday that the price was reaching one-month lows and looked set to continue falling, due to the outbreak of war in Ukraine, until it reached the cluster of very long-term support levels between $30k and $32,817.
This was not a good call as just after I made it the price turned around and has been rising ever since. I thought that the outbreak of war would hurt Bitcoin as a “risky” asset, but the war has instead mostly acted to boost the prices of commodities, especially crude oil, more than anything else.
The price has continued to advance over the past week, especially over the past few days, and now seems to be consolidating above the support at $42,896 and below the resistance at $45,668. The resistance level is very interesting as it has been a very pivotal level since early December 2021 and has been the upper boundary of all price action for the past two months.
The bottom line is that as long as the support level at $42,896 continues to hold and the resistance at $45,668 is not reached, the outlook will remain bullish, but a bearish reversal at $45,668 would be a significant bearish signal and would likely provide a great spot to enter a short swing trade.
If the price gets established above $45,668 that would be a very bullish sign.

Regarding the USD today, there will be a release of the ADP Non-Farm Employment Forecast at 1:15pm London time, followed by testimony of the Chair of the Federal Reserve before Congress on the semi-annual Monetary Policy Report at 3pm.
Source link


