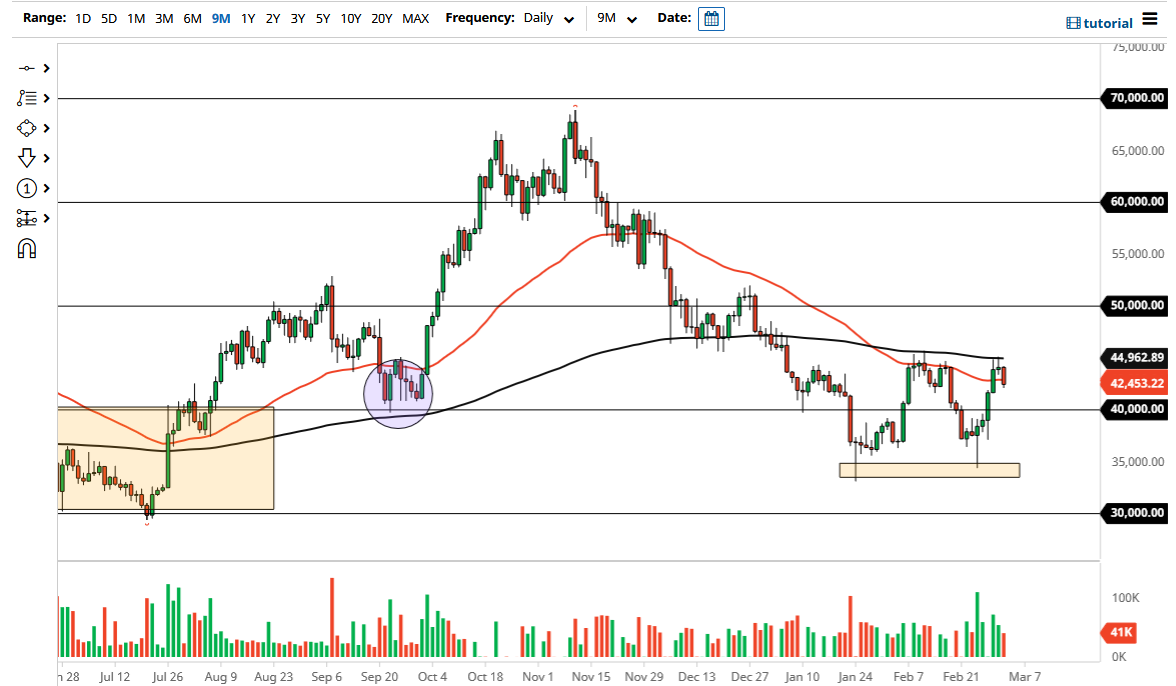
BTC/USD Forecast: Bitcoin Reenters Consolidation Area

Are we simply trying to grind away some of the losses and consolidate, or are we getting ready to go much lower?
Bitcoin has fallen during the trading session on Thursday as the 200 day EMA has shown itself to be far too much to overcome. At this point, the market is likely to continue going lower, perhaps reaching down towards the $40,000 level. While a lot of people were droning on and on about how Bitcoin was going to “go to the moon” again, the reality is that we are not in the right financial conditions for that to happen.
What I mean by this is that Bitcoin and crypto overall are considered to be a “risk asset.” Large amounts of money are needed to move the marketplace, which means institutional traders have a certain amount of influence. The institutions do not like jumping into an asset like Bitcoin when there is so much uncertainty. With that in mind, I do believe that the market has further to go to the downside and the fact that we are closing towards the bottom of the candlestick does in fact suggest that.
A breakdown below the $40,000 level could open up a move to much lower pricing, perhaps the bottom of the overall consolidation region which is at the $35,000 level. We are essentially stuck in a $10,000 range, which is nothing new for Bitcoin, and at this point, I think it is a decision to be made whether or not we are simply trying to grind away some of the losses and consolidate, or are we getting ready to go much lower?
I think a lot of this can be seen in the overall economic conditions, as we do not have an environment where a lot of people are going to be willing to trade risky assets. In fact, the favored assets right now include gold, US dollars, and Treasuries. This is a harsh inversion of anything involving crypto, so Bitcoin will continue to suffer.
That being said, it is possible that we break out to the upside and if we do, a daily candlestick closing above the $46,000 level might open up the possibility of a move towards the $50,000 level. That is obviously an area that will attract a lot of headline noise, so I think that it might be a bit difficult to simply slice through. Nonetheless, this chart does not suggest confidence I think we have further to the downside before it is all said and done.
Source link


