The pair will likely hold steady as bulls target the next key resistance level at 50,000 in the coming days.
Bullish View
- Buy the BTC/USD pair and set a take-profit at 50,000.
- Add a stop-loss at 46,000.
- Timeline: 2-3 days.
Bearish View
- Set a sell-stop at 45,760 and a take-profit at 42,000.
- Add a stop-loss at 48,000.
The BTC/USD spectacular comeback accelerated on Tuesday morning as US bond yields ticked lower and on-chain metrics improved. The pair rose to a high of 47,600, which was the highest it has been since January this year. It has risen by more than 45% from its year-to-date low.

US Bond Yields Ticked Lower
Bitcoin and other cryptocurrencies did relatively well even as warning signs of a recession emerged. On Monday, the yield curve inverted for the first time in years. This happened as the overall bond yields of short-term government bonds rose above the longer-dated ones. In normal times, investors demand a higher premium for longer-term bonds.
Historically, an inversion of bond yields is usually an indicator that a recession is in the corner. In most times, it could take several months or years before the recession sets in. The yield curve has been one of the best predictors of recessions in the past few years.
BTC/USD pair also rose as investors priced in more demand for Bitcoin as rumors emerged that Russia was considering accepting payments of oil and gas in the currency. These rumors are yet to be confirmed. If they are, they could be a game-changer considering that Russia is one of the biggest producers and exporters of oil and natural gas globally.
Meanwhile, on-chain data are still supportive of Bitcoin. According to Glassnode, Bitcoin whales have continued to accumulate Bitcoin in the past few weeks. Notably, the amount of outflows has been a bit limited. The activities of whales is usually watched closely by investors.
Other on-chain metrics like the number of active addresses has risen while transactions have increased in the past few days. Exchange balances have continued rising as well while the hash rate has increased.
BTC/USD Forecast
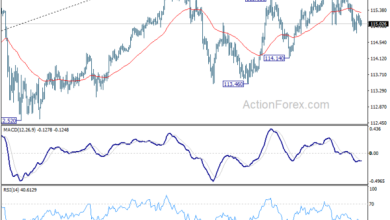
The daily chart shows that the BTC/USD pair has been in a strong bullish trend in the past few weeks. It managed to move above the important resistance level at 45,760, which was the highest level in February.
The pair has also managed to move above the 25-day and 50-day moving averages and is now hovering near the 50% Fibonacci retracement level. It has also moved slightly above the ascending trendline shown in black.
Therefore, the pair will likely hold steady as bulls target the next key resistance level at 50,000 in the coming days.
Source link