
Breaking Down the Balance Sheet
The Fed added $68B to its balance sheet in February. This was divided across $57B in MBS, $25B in Treasuries, and -$15B in Repos (i.e., Other and not to be confused with Reverse Repos). The Fed taper process is certainly not as clean as laid out on their website in Treasuries and MBS. In February, they purchased 42% above its original $40B target in MBS but has fallen back to 31% of its original $80B Treasury target.
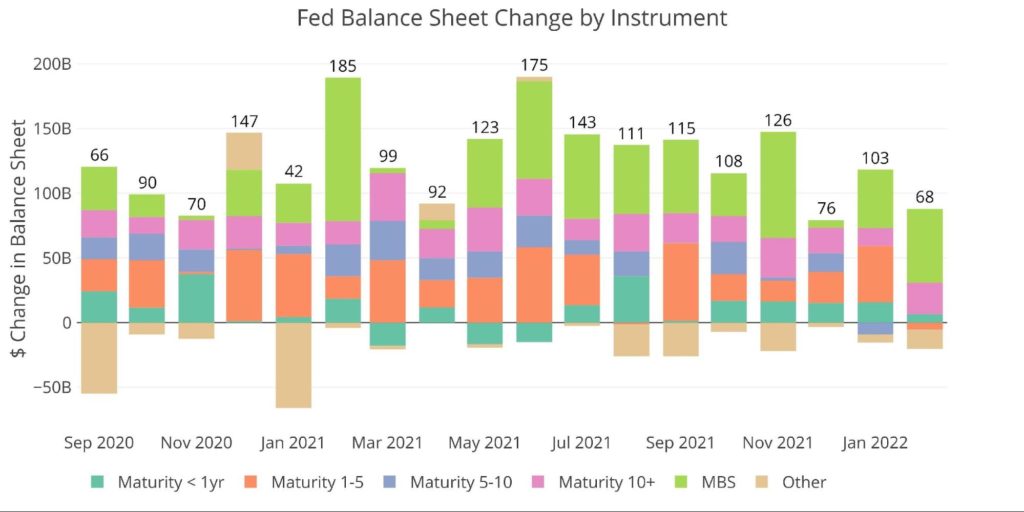
Figure: 1 Monthly Change by Instrument
As shown in the table below, the Balance Sheet now stands at a record $8.9T. The balance sheet will probably exceed $9T by the time the Fed completes its taper next month (assuming QE does officially end). In the latest month:
- The Fed bought on the short and long end of the curve, letting the middle part roll of
- 1–10-year maturities shrunk by 5.3B
- 10+ increased by $24B while short term debt increased $6.5B
- The $57B increase in MBS is more than 10% of the entire MBS bought over the last 12 months
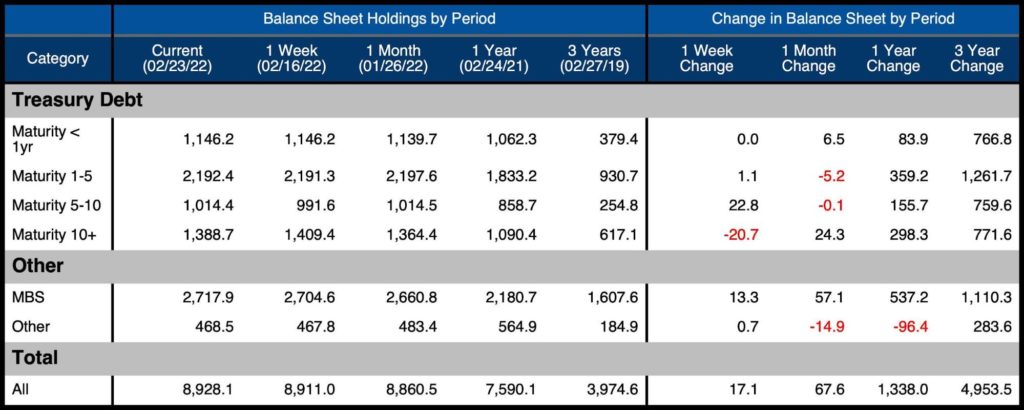
Figure: 2 Balance Sheet Breakdown
When looking at the weekly data, MBS securities showed no weekly decline throughout all of February. It should be expected that March will be a much smaller month than February. The slowing of treasury purchases is also fairly obvious to see.
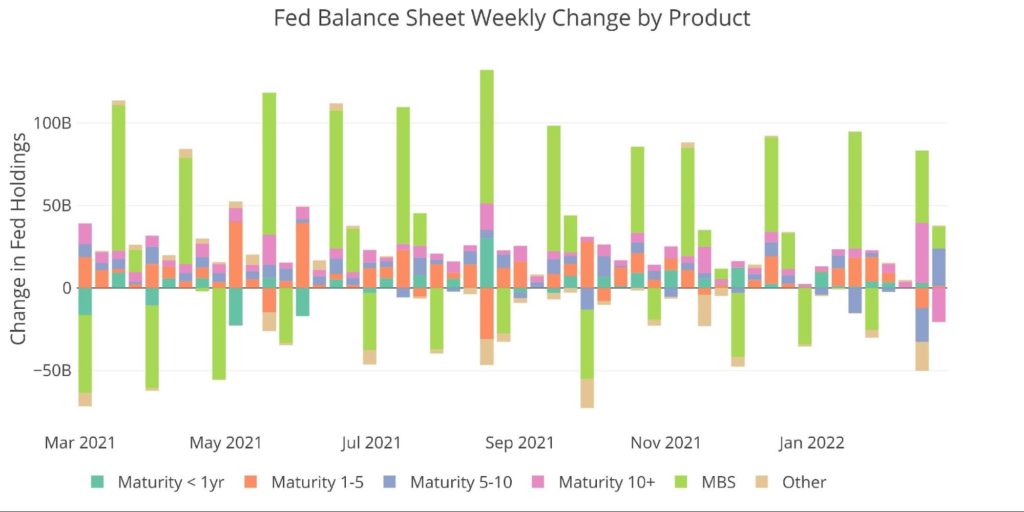
Figure: 3 Fed Balance Sheet Weekly Changes
The Fed works on a 4-week cycle. Thus, to normalize the data a bit more, the table below shows weekly average purchases over 4, 24, 52, and 156 (3 years) weeks. The weekly averages are shown to gauge whether the current periods (1 and 4 weeks) are accelerating or decelerating.
When looking at the 4-week average:
- Maturities <1 year and > 10 year both exceeded the 52-week average
- Maturities 1-10 year were well below all the averages
- MBS security purchases are also well above average
In total, the 4-week average of $17B is 32% below the $24-$26B seen over the last 24-52 weeks. This means that in 3 months of tapering, the Fed only got a third of the way to completion. They need to do the remaining two-thirds over the next 4 weeks!
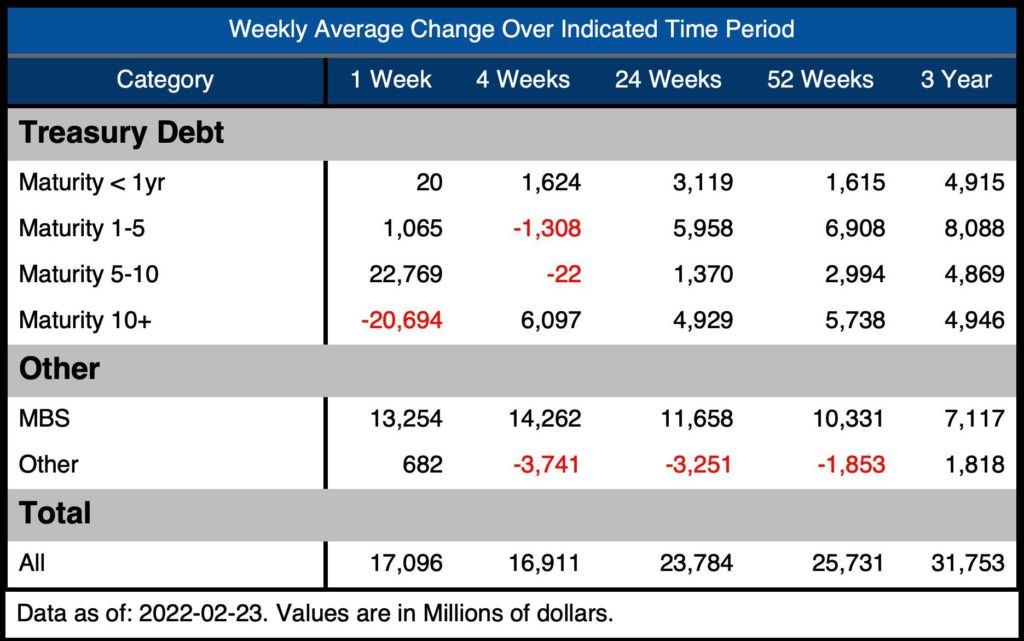
Figure: 4 Average Weekly Change in the Balance Sheet
With the Fed signaling their departure from the market, and somewhat following through, interest rates continue to climb and the yield curve continues to flatten.
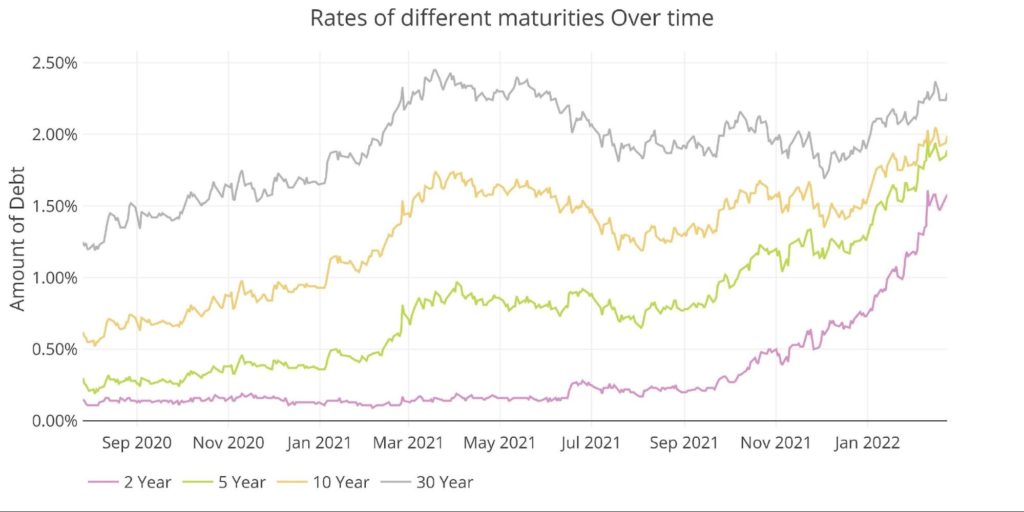
Figure: 5 Interest Rates Across Maturities
The difference between the 2-year and 10-year is now at 38bps, the lowest level April 2020. At the current trajectory, the Yield Curve could go inverted quite soon!
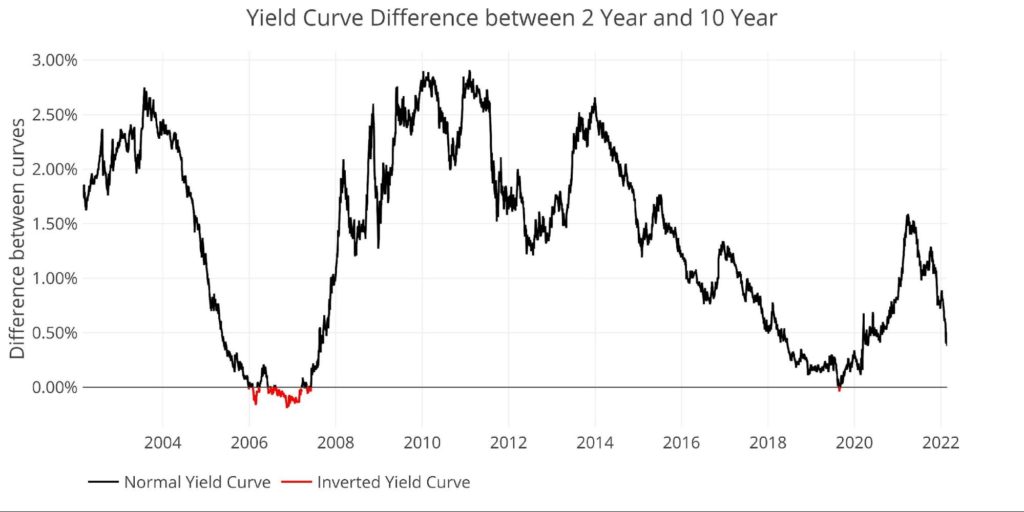
Figure: 6 Tracking Yield Curve Inversion
A final look at the yield curve compares the current shape to the one a year ago. This shows how flat the curve has become within Notes (1-year to 10-year). It has even inverted between the 20-year and 30-year. If the Fed starts aggressively raising rates to bring up the short end, the rest of the curve will invert.
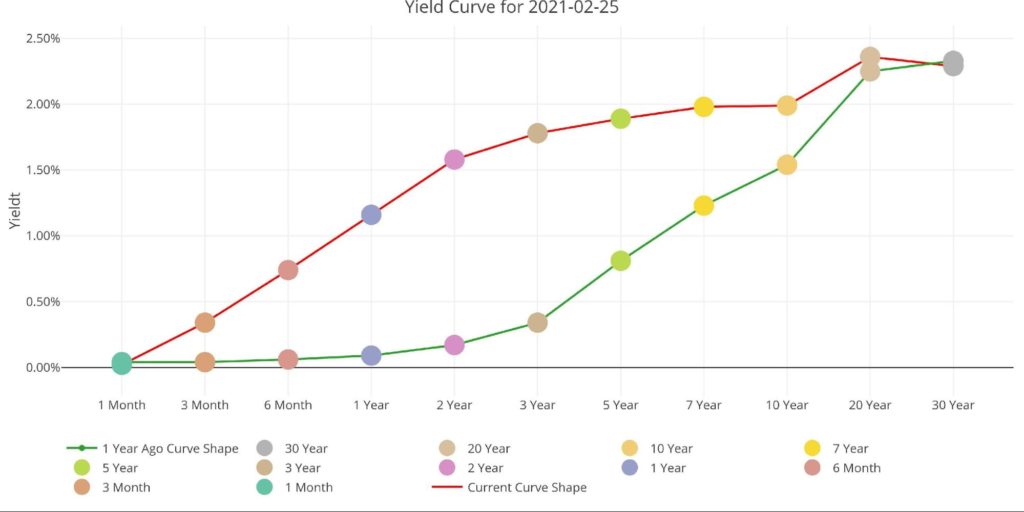
Figure: 7 Yield Curve
The Fed Monetization
The Fed monetized almost all the debt for 2020-2021. While monetization in 2022 is less than recent years, it’s still fairly noticeable with the Fed absorbing 8.2% of Bills, 24.5% of Notes, and 28% of Bonds.
Looking at the charts below, this is mainly being driven by much smaller debt issuance by the Treasury. The Treasury has enjoyed the luxury of large revenue increases, putting less pressure on the budget deficit. And requiring less debt issuance.
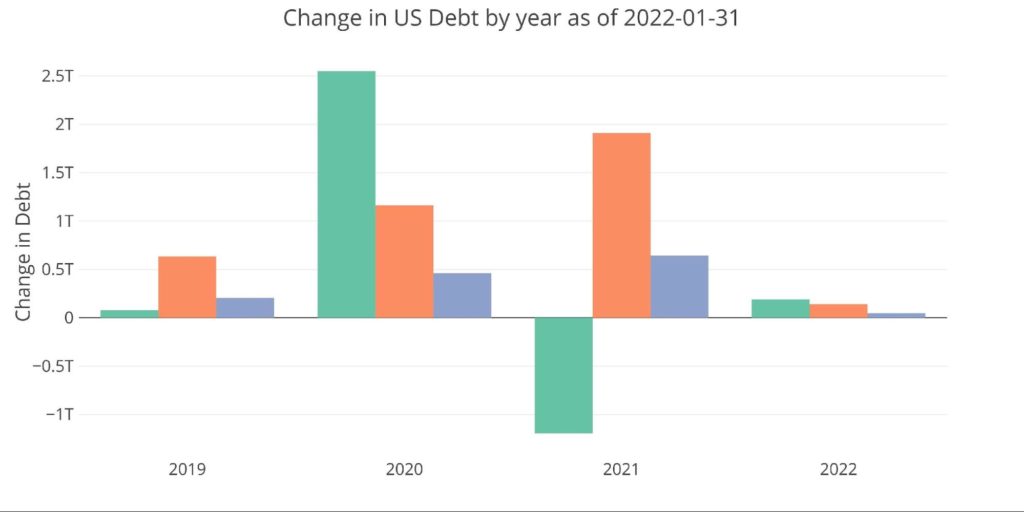
Figure: 8 Debt Issuance by Year and Instrument
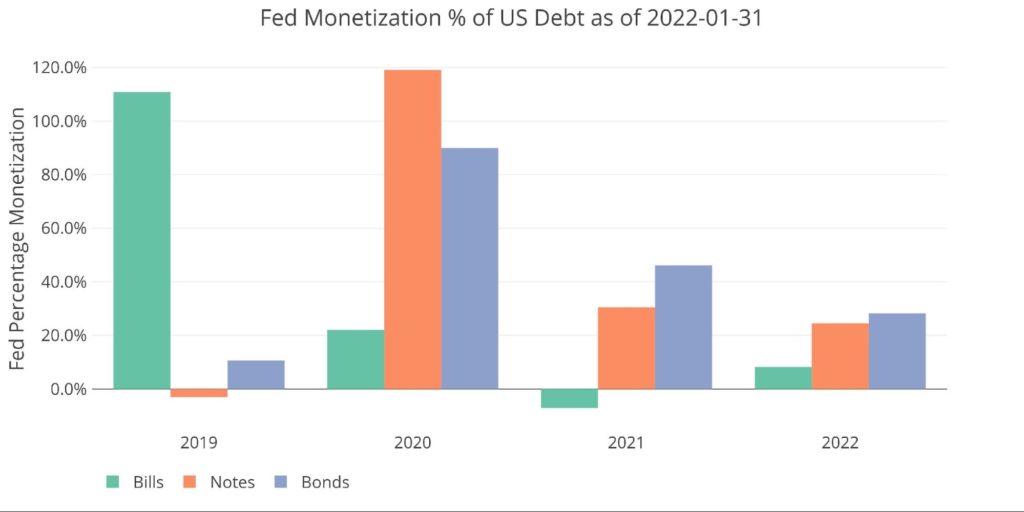
Figure: 9 Fed Purchase % of Debt Issuance
Who Will Fill the Gap?
Perhaps the most shocking part of lower Treasury issuance is how much rates have risen (bond prices have fallen) despite lower supply. If the Treasury tax revenue windfall declines, requiring more debt issuance, who is going to step up?
The chart below looks at international holders of Treasury securities. Since December 2019, the rest of the world has not purchased just over $1T despite the Treasury adding $4.5T in 2020 and $1.9T in 2021!
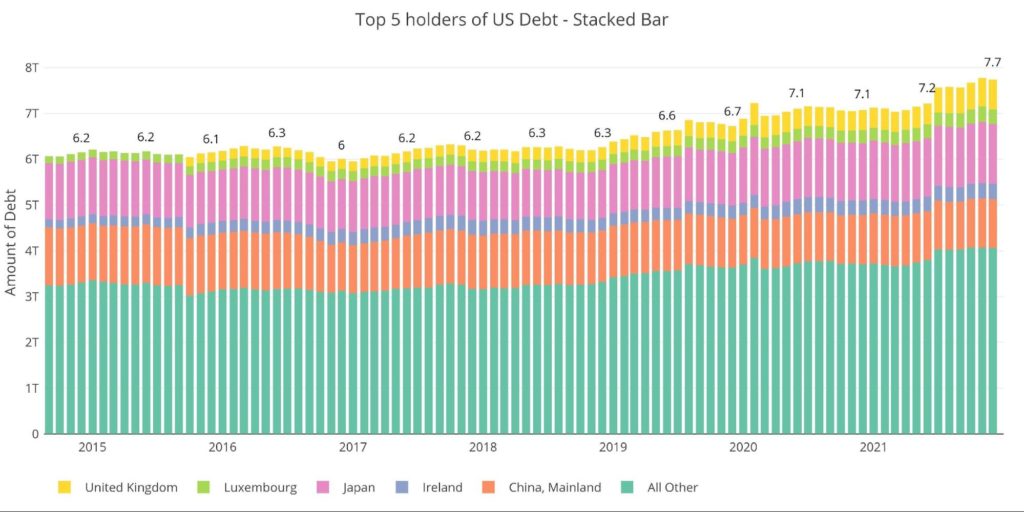
Figure: 10 International Holders
The table below shows how debt holding has changed since 2015 across different borrowers. While everyone else has increased holdings, China has decreased holdings since 2015 as it divests itself of US Debt. More importantly, it should become clear that international holders have really lost their appetite at large. Total holdings have increased by $1.6T, but in that time, US debt has increased 7.5x that amount at $12T!
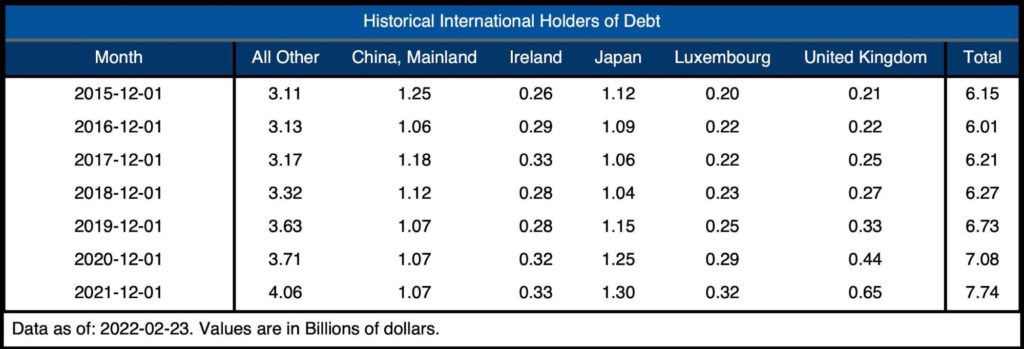
Figure: 11 Average Weekly Change in the Balance Sheet
The next chart details the distribution of the Fed balance sheet. The recent aggressive purchases of MBS can be seen in the MBS current bar being above the orange bar from one year ago. This has mainly come as a result of declining “Others” (Repos) rather than Treasury securities.
Historical Perspective
The final plot below takes a larger view of the balance sheet. It is clear to see how the usage of the balance sheet has changed since the Global Financial Crisis. The tapering from 2017 to 2019 can be seen in the slight dip before the massive surge due to Covid.
There is no way the Fed will come close to shrinking the balance sheet at this stage. Most forecasters are suggesting the Fed can get down to $6T before causing serious pain in financial markets. This seems laughable given how little it took in 2018 to send the markets into a tailspin.
At least one positive for the Fed is a stalemate in Congress against surging tax revenues. If this helps shore up the Federal Budget deficit, then maybe they can push into QT. Unfortunately, this might be a temporary relief for everyone before interest rates start rising, debt starts exploding, and the Fed is back to monetizing.
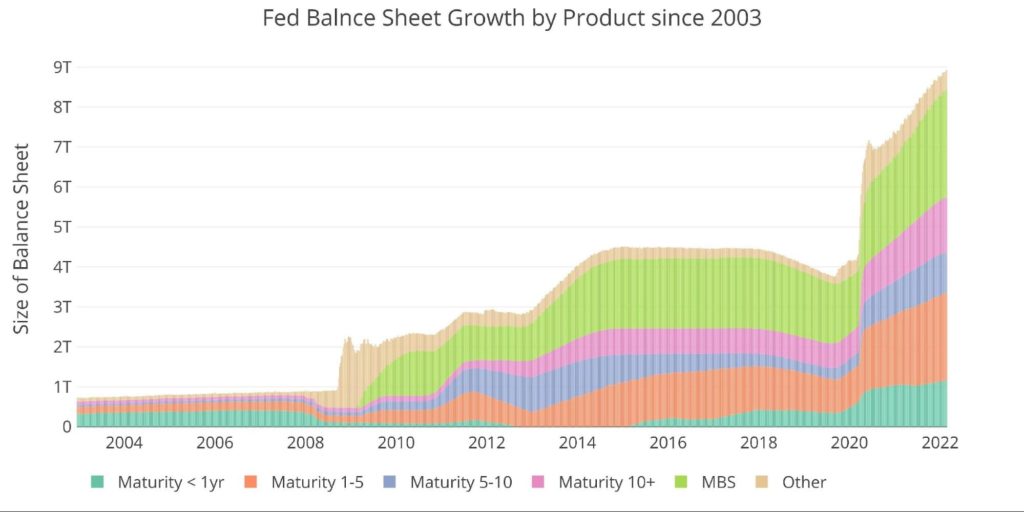
Figure: 12 Historical Fed Balance Sheet
What it means for Gold and Silver
The Fed is in a box. They are going to try and do the impossible of letting interest rates rise and their balance sheet fall without causing a recession. They are already miles behind the inflation curve, so it doesn’t seem like matters are going to get better for them in the near future.
The Fed is scheduled to complete the taper next month and start shrinking the balance sheet in June. Time will tell if they can pull off the greatest magic trick ever.
Data Source: https://fred.stlouisfed.org/series/WALCL and https://fred.stlouisfed.org/release/tables?rid=20&eid=840849#snid=840941
Data Updated: Weekly, Thursday at 4:30 PM Eastern
Last Updated: Feb 23, 2022
Interactive charts and graphs can always be found on the Exploring Finance dashboard: https://exploringfinance.shinyapps.io/USDebt/

Call 1-888-GOLD-160 and speak with a Precious Metals Specialist today!
Buka akaun dagangan patuh syariah anda di Weltrade.
Source link