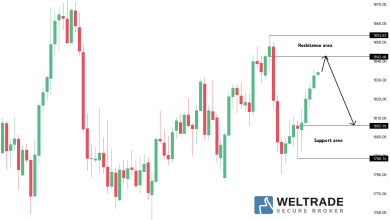
There is a likelihood that the pair will resume the bearish trend this week.
Bearish View
- Set a sell-stop at 36,000 and a take-profit at 33,000.
- Add a stop-loss at 38,000.
- Timeline: 1-2 days.
Bullish View
- Set a buy-stop at 39,000 and a take-profit at 41,000.
- Add a stop-loss at 37,000.
The BTC/USD pair remained in a tight range even after a major warning by a senior IMF official. The pair is trading at 38,000, where it has been in the past few days.

Bitcoin Price Holds Steady
The performance of the BTC/USD pair is attributed to several factors. First, it tilted higher as American equities bounced back ahead of key quarterly results by top technology companies like Amazon, Meta Platforms, and Alphabet.
The Dow Jones and the S&P 500 indices jumped as investors anticipated strong results by these tech giants. After reporting weak results last month, analysts believe that Amazon will publish strong Q4 results because of the holiday season and demand for cloud computing.
In the past few weeks, the performance of Bitcoin and other cryptocurrencies has mirrored that of American stocks. That’s mostly because the Fed is the one driving the performance of the market. In its decision last week, the bank hinted that it will hike interest rates several times this year.
The BTC/USD pair wavered after a senior advisor to the IMF warned about the potential risks that cryptocurrencies pose to emerging and developing countries. Already, El Salvador has become the first country to accept Bitcoin as a legal tender, a move that has been criticized by the IMF.
Other emerging market countries have announced measures to restrict the currencies. China has already banned cryptocurrencies while India is considering banning the coins. In a statement last month, the Russian central bank recommended that the government should ban digital coins.
Still, a closer look at on-chain data shows that activity in the Bitcoin ecosystem is doing well. For example, mining difficulty has jumped close to an all-time high. At the same time, the hash rate has done modestly well in the past few days.
BTC/USD Forecast
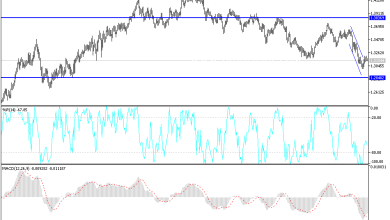
The four-hour chart shows that the BTC/USD pair has been in a tight range in the past few days. The pair is hovering slightly above the standard pivot point. It is also oscillating near the 25-day and 50-day exponential moving averages (EMA) while the Relative Strength Index (RSI) has been in a bullish trend.
However, a closer look at the pair shows that it has formed a rising wedge pattern. Therefore, there is a likelihood that the pair will resume the bearish trend this week. If this happens, a drop to last week’s low at 30,000 cannot be ruled out.

Source link