Bullish View
- Buy the BTC/USD pair and set a take-profit at 44,000.
- Add a stop-loss at 41,000.
- Timeline: 1-2 days.
Bearish View
- Sell the BTC/USD and set a take-profit at 41,500.
- Add a stop-loss at 43,500.
The BTC/USD was relatively resilient in the overnight session even as American equities retreated on Ukraine fears. The pair is trading at 42,700, which is a few points above last week’s low of 41,566.

Bitcoin Steady Amid the Chaos
Bitcoin has been under pressure as investors reflect on multiple factors. On the one hand, there are fears about the Federal Reserve, which is set to embrace a more combative monetary policy this year considering that the American labor market has tightened and inflation soared.
Recent data revealed that the US unemployment rate rose slightly to 4.0% in January while inflation jumped to a 40-year high of 7.5%. Therefore, the Fed is expected to end its quantitative easing (QE) program and start hiking interest rates this year.
The BTC/USD pair has also held steady even as stocks fall amid the rising tensions between Western countries and Russia. These countries have accused Russia of attempting to invade Ukraine like it did in 2014.
The strong performance is likely because many Americans who watched Super Bowl on Sunday bought Bitcoin after the multiple ads. Cryptocurrency companies like Coinbase, FTX, and Crypto.com all spent millions of dollars to advertise. Estimates are that 160 million people or half of the US tuned in to watch the match.
Meanwhile, on-chain data show that the network activity is still strong in the industry. According to Messari, the number of Bitcoin addresses has jumped to more than 40 million while active accounts rose by over 800k in the past 24 hours.
The number of transactions in the past 24 hours were worth over $9 billion while the hash rate rose to 210 MH/s.
BTC/USD Forecast
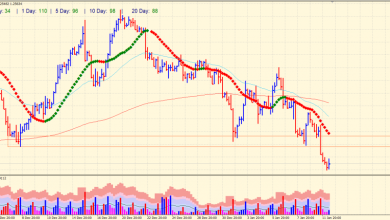
The four-hour chart shows that the BTC/USD pair moved sideways in the past few days. It is trading at 42,564, which is a few points above last week’s low of 41,618. The pair has moved to the 25-day and 50-day moving average and formed what looks like an inverted head and shoulders pattern. The MACD lines are slightly below the neutral line.
Therefore, at this point, the outlook of the pair is neutral with a bullish bias because of the inverted head and shoulders pattern. If it breaks out, the next key resistance level to watch will be at 45,000. On the flip side, a drop below 41,700 will invalidate the bullish view.

Source link