Natural Gas Technical Analysis: Price Trying to Recover

Spot natural gas prices (CFDS ON NATURAL GAS) rose during the recent trading at the intraday levels. It achieved daily gains until the moment of writing this report, by 2.73% and settled at the price of $4.202 per million British thermal units. It rose during Friday’s trading by 1.24 %, thus breaking a series of losses that continued for six consecutive sessions, during the past week. The immediate natural gas declined by -13.29%.
Expectations of steady warming for February proved insurmountable for the bulls to beat, as higher temperatures are likely to prevent a much deeper decline in stockpiles heading towards the end of the traditional pullback season. The March Nymex contract closed the week at $3,941/MMBtu, down about 1.8 cents on the day. The April contract fell only eight-tenths of a cent to settle at $3.935.
The latest cold snap across the eastern half of the United States is expected to lead to a significant increase in gas consumption after a period of several days of spring weather and tepid heating demand. Forecasters expected the winter storm to send a wave from the mid-Atlantic to New England, bringing temperatures down and clearing the way for several inches of snow.
Freezing air was expected to be circulating well into the southern US as well, with it expected to be coldest on Monday before the midweek warm-up begins.
Meanwhile, tensions escalated between Russia and Ukraine, after the White House warned that Russia could invade Ukraine soon. Jake Sullivan, President Joe Biden’s national security adviser, told reporters on Friday, “We continue to see signs of a Russian escalation, including the arrival of new forces at the border. Ukrainian”. The New York Times quoted Sullivan as warning that the invasion could begin “during the Winter Olympics in China” and that all Americans should leave Ukraine within the next 24 to 48 hours.
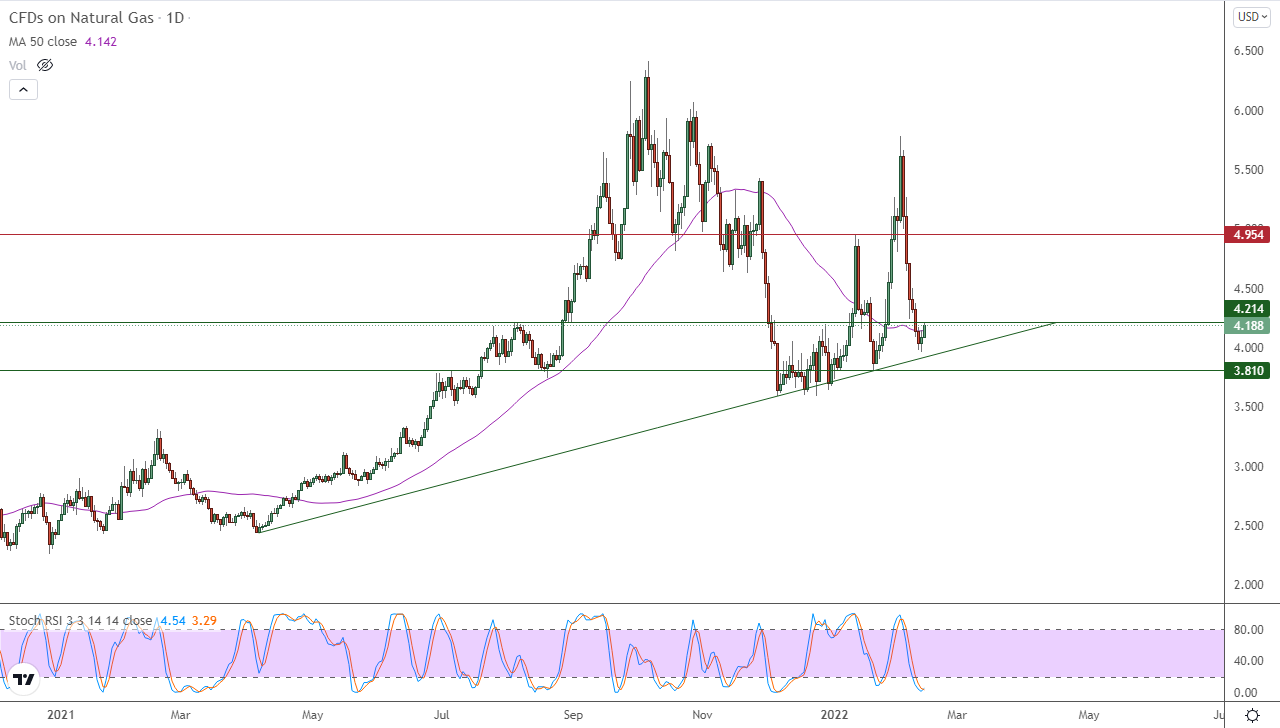
Technically, the price found some support by relying on a main bullish trend line in the medium term, as shown in the attached chart for a (daily) period. This coincided with its support for its simple moving average for the previous 50 days, and the relative strength indicators reaching oversold areas , exaggeratedly compared to the price movement. It suggests the beginning of positive divergence in it, especially with the beginning of the emergence of a positive crossover, to see the price has bounced up as a result of this double positive pressure.
Therefore, our expectations suggest more ascent for natural gas during its upcoming trading, especially in the event of its stability returning above the 4.214 level, after which it will target the resistance level 4.954.

Source link


