Our expectations suggest a return to the rise of natural gas during its upcoming trading.
Spot natural gas prices (CFDS ON NATURAL GAS) decreased during the recent trading at the intraday levels. It recorded new daily losses until the moment of writing this report, by -3.40% to settle at the price of $4,550 per million British thermal units. This is after declining sharply during Friday’s trading, and for the second day in a row, a rate of -7.76%.
Natural gas futures weakened again on Friday, as mid-February weather forecasts continued to rise. The effects from the current winter storm penetrating the US proved modest thus far. The March Nymex gas futures contract closed the week at $4,572/MMBtu, versus 31.6 cents from Thursday’s close. The April contract fell by 22.8 cents to $4.492.
Spot gas prices also declined by NGI’s Spot Gas National Avg. With expectations of a rise in temperature for the coming days, it fell by 36.0 cents to settle at $6,620.
With temperatures expected to rise significantly in the US from recent freezing levels, traders have been watching whether Arctic skies can quickly return. Weather models in recent cycles have receded from the intensity of the cold wave looming in the middle of the month.
NatGasWeather said the European model as of Friday was still warmer and longer duration with outages expected in the coming days compared to the US Global Forecasting System (GFS) model, but the GFS was heading for warmer. Both models favor the freezing air over southern Canada that rushes back into the United States on February 13-17 in order to return to stronger national demand. However, the coverage and density of subfreezing air in the Lower 48 region has not been as impressive and ominous in recent days compared to what data showed earlier in the week.
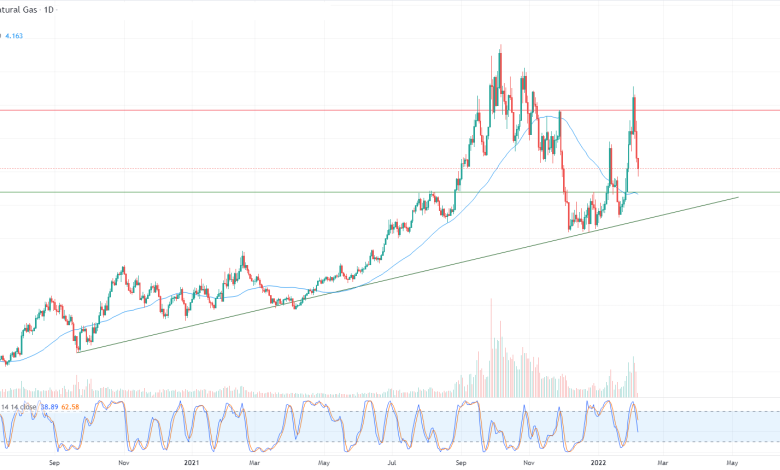
Technically, the decline in natural gas came as an attempt to search for a new bullish bottom on which the price would take a base to help it gain positive momentum that might help it recover and rise again.
All of this comes in the dominance of the main bullish trend in the medium term along a slope line, with the positive pressure continuing to trade above its simple moving average for the previous 50 days, as shown in the attached chart for a (daily) period.
Therefore, our expectations suggest a return to the rise of natural gas during its upcoming trading, but provided that the pivotal support level 4.200 remains intact, to target the first resistance levels at 5.426.

Source link