The Federal Reserve tends to keep the fed funds rate within a 2.0% to 5.0% sweet spot that helps maintain a healthy economy, but there have been exceptions. The nation’s benchmark rate has been increased well above that range at times to curb runaway inflation. It also has dipped well below 2% to stimulate economic growth.
Examining the Fed’s changes to the fed funds rate provides insight into how the Fed has managed both inflation and recessions.
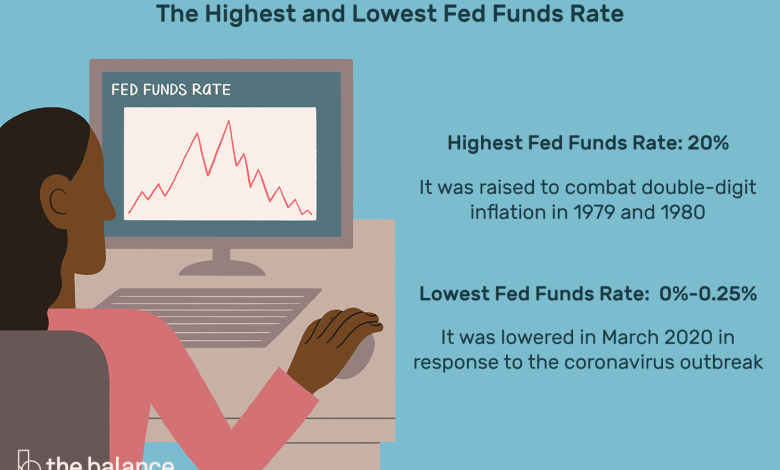
Lowest Fed Funds Rate
The all-time funds rate low is effectively zero. The Fed has twice lowered the rate to a range of 0.0% to 0.25%. The first time was during the financial crisis of 2008, and the Fed didn’t resume raising rates until December 2015.
The second time was in March 2020, as a result of the global health crisis. The Fed announced in June 2021 that it would keep rates in that range until 2023. Most recently, at the January 2022 Federal Open Market Committee (FOMC) meeting, the Fed said that it would keep its target for the fed funds rate at a range of 0.0% to 0.25%.
The lowest fed funds rate (before 2008) was in the range of 0.75% to 1.0% in 2003 in a move to combat the 2001 recession. There were fears that the economy was drifting toward deflation at that time.
Deflation occurs when prices keep falling, convincing buyers to delay purchases as they wait for still lower prices.
Highest Fed Funds Rate
The fed funds rate reached a high of 20% in 1980 to combat double-digit inflation.
Inflation began to skyrocket beginning in March 1973 when President Richard Nixon disengaged the dollar from the gold standard. Inflation increased from 4.7% to 12.3% in December 1974. The Fed increased the fed funds rate from 7% in March to 11% by August.
Inflation continued to remain in the double digits through April 1975. The Fed increased the benchmark rate to 16% in March 1975, worsening the 1973 to 1975 recession. It then reversed course, dramatically lowering the rate to 5.25% by April 1975.
These sudden changes were part of a “stop-go” monetary policy, and they weren’t sustained enough to either end inflation or spur growth. Confused businesses kept prices high to stay ahead of the Fed’s interest rate spikes, which only made inflation worse. Fed leaders learned that managing inflation expectations was a critical factor in controlling inflation itself.
Federal Reserve chair Paul Volcker ended the Fed’s stop-go policy in 1979. He instead raised rates and kept them there to finally end inflation. That created the 1980 recession, but it thoroughly ended double-digit inflation, which hasn’t been a threat since.
Fed Funds Rate History
The charts below show the targeted fed funds rate changes since 1971. The Federal Open Market Committee (FOMC) didn’t announce its target interest rate after meetings until October 1979. The Fed adjusted the rate through its open market operations. Banks were forced to guess what the rates would be as a result. The Fed tried to fight inflation without managing the expectations of inflation.
The Fed began targeting the money supply to fight inflation in 1979. The fed funds rate fluctuated a great deal between 1979 and 1982 as a result. Then in 1982, the Fed returned to targeting the fed funds rate.
The FOMC formally announced its policy changes for the first time in February 1994. Its announcements since then have made clear what it wants the interest rate to be. This policy manages expectations of inflation and minimizes disruptions caused by surprises from the Fed.
These are the target fed funds rates, along with the events that triggered the changes in cases where they did so. The Fed typically announces a range for its benchmark rate. The tables below show the high end of the range, while the low end is a quarter-point lower. Each year also includes:
- The GDP
- The unemployment rate
- The inflation rate
Fed Chair Arthur Burns (January 1970-March 1978)
The GDP was 3.3% in 1971, the unemployment rate was 6.0%, and inflation was 4.4%.
| Date | Fed Funds Rate | Event |
|---|---|---|
| Jan. 12 | 4.25% | Expansion |
| Feb. 9 | 3.75% | No notable event |
| March 9 | 5.0% | Inflation at 4.7% year-over-year |
| July 27 | 5.5% | Nixon shock; weakened gold standard; tariffs |
| Aug. 24 | 5.75% | Wage-price controls |
| Oct. 19 | 5.25% | Fed lowered rate to boost growth |
| Nov. 16 | 5.0% | No notable event |
The GDP was 5.3% in 1972. Unemployment was 5.2%, and inflation was 3.2%.
| Date | Fed Funds Rate | Event |
|---|---|---|
| March 21 | 5.5% | Nixon devalued dollar, creating inflation |
| Dec. 19 | 5.75% | Fed raised rate to combat 3.4% YOY inflation |
The GDP was 5.6% in 1973, unemployment was 4.9%, and inflation was 6.2%.
| Date | Fed Funds Rate | Event |
|---|---|---|
| Jan. 19 | 6.0% | Stagflation |
| Feb. 23 | 6.5% | No notable event |
| March 20 | 7.0% | No notable event |
| April 17 | 7.25% | Inflation at 5.1% |
| May 15 | 7.5% | Inflation at 5.5% |
| June 19 | 8.5% | Inflation at 6.0% |
| July 17 | 10.25% | Recession |
| Aug. 21 | 11.0% | OPEC embargo worsened inflation in October |
The GDP was -0.5% in 1974, unemployment was 7.2%, and inflation was 11.0%.
| Date | Fed Funds Rate | Event |
|---|---|---|
| Feb. 20 | 9.0% | Recession |
| March 19 | 10.0% | Embargo ended in March |
| April 16 | 11.0% | Fed raised rates to stop inflation |
| July 16 | 13.0% | Inflation at 11.5%; Ford replaced Nixon in August |
| Nov. 19 | 9.25% | Recession combined with 12.2% YOY inflation. |
| Dec. 17 | 8.0% | Fed lowered rates to end recession. |
The GDP was -0.2% in 1975, unemployment was 8.2%, and inflation was 9.1%.
| Date | Fed Funds Rate | Event |
|---|---|---|
| Jan. 21 | 7.0% | No notable event |
| Feb. 19 | 6.0% | Economy contracted 4.8% in Q1 with inflation at 11.2% |
| March 21 | 5.5% | Recession ended |
| April 15 | 5.25% | Inflation at 10.2%, Unemployment at 9% |
| June 17 | 6.25% | Inflation at 9.4% |
| Sept. 16 | 6.5% | Inflation falls to 7.9% |
The GDP was 5.4% in 1976, unemployment was 7.8%, and inflation was 5.8%.
| Date | Fed Funds Rate | Event |
|---|---|---|
| Jan. 20 | 4.75% | Rate lowered from October through January |
| May 18 | 5.5% | Raised in April and May |
| Oct. 19 | 5.0% | Official end of gold standard |
| Nov. 16 | 4.75% | Lowered from July–November |
The GDP was 4.6% in 1977, unemployment was 6.4%, and inflation was 6.5%.
| Date | Fed Funds Rate | Event |
|---|---|---|
| Aug. 16 | 6.0% | Inflation rises to 7% in April |
| Sept. 20 | 6.25% | Inflation at 6.6% |
| Oct. 18 | 6.5% | Raised again in September and October |
Fed Chair William Miller (March 1978-August 1979)
The GDP was 5.5% in 1978, unemployment was 6.0%, and inflation was 7.6%.
| Date | Fed Funds Rate | Event |
|---|---|---|
| Jan. 17 | 6.75% | Inflation rises to 6.8% |
| April 19 | 7.0% | No notable event |
| May 17 | 7.5% | No notable event |
| June 21 | 7.75% | No notable event |
| Aug. 16 | 8.0% | Inflation rises to 7.8% |
| Sept. 20 | 8.5% | No notable event |
| Oct. 18 | 9.0% | Inflation at 8.9% |
| Nov. 21 | 9.75% | No notable event |
| Dec. 20 | 10.0% | Raised each month from April through December |
Fed Chair Paul Volcker (August 1979-August 1987)
The GDP was 3.2% in 1979, unemployment was 6.0%, and inflation was 11.3%.
| Date | Fed Funds Rate | Event |
|---|---|---|
| April 17 | 10.25% | Inflation at 10.5% |
| July 20 | 10.5% | No notable event |
| Aug. 15 | 11.0% | No notable event |
| Sept. 19 | 11.5% | Inflation rose to 12.2% |
| Oct. 8 | 13.0% | The Fed began targeting the money supply |
| Oct. 22 | 15.5% | Conference call raised rates 2.5 points |
| Nov. 20 | 14.0% | Inflation at 12.6% |
The GDP was -0.3% in 1980, unemployment was 7.2%, and inflation was 13.5%.
| Date | Fed Funds Rate | Event |
|---|---|---|
| Feb. 15 | 15.0% | Recession began in January, Inflation at 14.2% |
| March 18 | 20.0% | No notable event |
| May 15 | 11.5% | Conference calls on April 29 and May 6 lowered rates |
| June 5 | 8.5% | Recession ended in July |
| Aug. 7 | 10.0% | The Fed raised rates; inflation at 12.9% |
| Sept. 16 | 11.0% | No notable event |
| Oct. 13 | 12.0% | No notable event |
| Nov. 21 | 18.0% | Inflation eased to 12.6% |
| Dec. 5 | 20.0% | Conference call |
| Dec. 29 | 18.0% | Lowered two points |
The GDP was 2.5% in 1981, unemployment was 8.5%, and inflation was 10.3%.
| Date | Fed Funds Rate | Event |
|---|---|---|
| Feb. 3 | 20.0% | Reagan took office; Volcker raised rates again |
| April 28 | 16.0% | Conference call lowered rates |
| May 18 | 20.0% | Recession began in July |
| Nov. 17 | 13.0% | Gradually lowered rates over 6 months |
| Dec. 22 | 12.0% | Inflation at 8.9% |
The GDP was -1.8% in 1982, unemployment was 10.8%, and inflation was 6.2%. Data from 1982–2007 is from the Federal Reserve Bank of St. Louis’ discontinued target fed funds rate series.
| Date | Fed Funds Rate | Event |
|---|---|---|
| March 30 | 15.0% | Gradually raised rates 3 points over 4 months |
| July 15 | 13.0% | Conference call; gradually lowered rates |
| Aug. 24 | 9.5% | Gradually lowered rates |
| Nov. 16 | 9.5% | Recession ends |
| Dec. 21 | 8.5% | Inflation at 3.8% |
The GDP was 4.6% in 1983, unemployment was 8.3%, and inflation was 3.2%.
| Date | Fed Funds Rate | Event |
|---|---|---|
| May 24 | 8.63% | Gradually raised rates over 5 months |
| Aug. 23 | 9.75% | Raised from May to August |
| Oct. 4 | 9.38% | Lowered from August to October |
The GDP was 7.2% in 1984, unemployment was 7.3%, and inflation was 4.3%.
| Date | Fed Funds Rate | Event |
|---|---|---|
| March 29 | 10.5% | Raised rates again |
| July 17 | 11.0%. | No notable event |
| Aug. 21 | 11.5% | Raised from March to August |
| Oct. 2 | 11% | Began lowering again |
| Nov. 7 | 10% | No notable event |
| Dec. 18 | 8.75% | Lowered from September to December |
The GDP was 4.2% in 1985, unemployment was 7.0%, and inflation was 3.6%.
| Date | Fed Funds Rate | Event |
|---|---|---|
| March 26 | 8.38% | Raised from February to mid-March |
| May 20 | 7.75% | Began lowering again |
| Aug. 20 | 7.75% | Raised again |
| Dec. 17 | 8.0% | Lowered again |
The GDP was 3.5% in 1986, unemployment was 6.6%, and inflation was 1.9%.
| Date | Fed Funds Rate | Event |
|---|---|---|
| April 18 | 7.31% | Continued lowering rates |
| Aug. 21 | 5.88% | Lowered until August |
| Dec. 16 | 5.88% | Began raising rates again |
Fed Chair Alan Greenspan (August 1987-January 2006)
The GDP was 3.5% in 1987, unemployment was 5.7%, and inflation was 3.6%.
| Date | Fed Funds Rate | Event |
|---|---|---|
| May 19 | 6.5% | Continued raising rates to fight inflation |
| Sept. 22 | 7.25% | No notable event |
| Nov. 4 | 6.81% | Lowered after Black Monday stock market crash |
The GDP was 4.2% in 1988, unemployment was 5.3%, and inflation was 4.1%.
| Date | Fed Funds Rate | Event |
|---|---|---|
| Feb. 10 | 6.25% | Continued lowering |
| March 29 | 6.5% | Began raising to fight inflation |
| Aug. 16 | 8.13% | No notable event |
| Dec. 14 | 8.38% | No notable event |
The GDP was 3.7% in 1989, unemployment was 5.4%, and inflation was 4.8%.
| Date | Fed Funds Rate | Event |
|---|---|---|
| Dec. 19 | 8.5% | S&L crisis; The Fed lowered rates to calm markets |
The GDP was 1.9% in 1990, unemployment was 6.3%, and inflation was 5.4%.
| Date | Fed Funds Rate | Event |
|---|---|---|
| July 13 | 8.25% | Recession began in July |
| Oct. 29 | 7.75% | Continued lowering rates to boost economy despite inflation |
| Nov. 14 | 7.5% | No notable event |
| Dec. 7 | 7.25% | Conference call |
| Dec. 18 | 7.25% | Economy contracted 3.6% in Q4 |
The GDP was -0.1% in 1991, unemployment was 7.3%, and inflation was 4.2%.
| Date | Fed Funds Rate | Event |
|---|---|---|
| Jan. 9 | 6.75% | Economy contracted 1.9% |
| Feb. 1 | 6.25% | No notable event |
| March 8 | 6.0% | Recession ended |
| April 30 | 5.75% | Conference call |
| Aug. 6 | 5.5% | No notable event |
| Sept. 13 | 5.25% | Conference call |
| Oct. 31 | 5.0% | Conference call |
| Nov. 6 | 4.75% | Fed continued lowering rates to fight unemployment |
| Dec. 6 | 4.5% | No notable event |
| Dec. 20 | 4.0% | No notable event |
The GDP was 3.5% in 1992, unemployment was 7.4%, and inflation was 3.0%.
| Date | Fed Funds Rate | Event |
|---|---|---|
| April 9 | 3.75% | Fed lowered rates to fight unemployment |
| July 2 | 3.25% | No notable event |
| Sept. 4 | 3.0% | No notable event |
In 1993, the GDP was 2.8%, unemployment was 6.5%, and inflation was 3.0%. President Clinton took office in 1993. The Fed made no changes.
The GDP was 4.0% in 1994, unemployment was 5.5%, and inflation was 2.6%.
| Date | Fed Funds Rate | Event |
|---|---|---|
| Feb. 4 | 3.25% | Fed raised rates to keep economy healthy |
| March 22 | 3.5% | No notable event |
| April 18 | 3.75% | Conference call |
| May 17 | 4.25% | No notable event |
| Aug. 16 | 4.75% | No notable event |
| Nov. 15 | 5.5% | Raised rates |
The GDP was 2.7% in 1995, unemployment was 5.6%, and inflation was 2.8%.
| Date | Fed Funds Rate | Event |
|---|---|---|
| Feb. 1 | 6.0% | Raised rates |
| July 6 | 5.75% | Lowered rates |
| Dec. 19 | 5.5% | No notable event |
The GDP was 3.8% in 1996, unemployment was 5.4%, and inflation was 3.0%.
| Date | Fed Funds Rate | Event |
|---|---|---|
| Jan. 31 | 5.25% | Kept rates low despite inflation |
The GDP was 4.4% in 1997, unemployment was 4.7%, and inflation was 2.3%.
| Date | Fed Funds Rate | Event |
|---|---|---|
| March 25 | 5.5% | Raised rates despite low inflation |
The GDP was 4.5% in 1998, unemployment was 4.4%, and inflation was 1.6%.
| Date | Fed Funds Rate | Date |
|---|---|---|
| Sept. 29 | 5.25% | Lowered rates to fight LTCM crisis |
| Oct. 15 | 5.0% | No notable event |
| Nov. 17 | 4.75% | No notable event |
The GDP was 4.8% in 1999, unemployment was 4.0%, and inflation was 2.2%.
| Date | Fed Funds Rate | Event |
|---|---|---|
| June 30 | 5.0% | Raised rates because economy was doing well |
| Aug. 24 | 5.25% | No notable event |
| Nov. 16 | 5.5% | No notable event |
The GDP was 4.1% in 2000, unemployment was 3.9%, and inflation was 3.4%.
| Date | Fed Funds Rate | Event |
|---|---|---|
| Feb. 2 | 5.75% | No notable event |
| March 21 | 6.0% | No notable event |
| May 16 | 6.5% | Raised rates despite stock market drop |
The GDP was 1.0% in 2001, unemployment was 5.7%, and inflation was 2.8%.
| Date | Fed Funds Rate | Event |
|---|---|---|
| Jan. 3 | 6.0% | No notable event |
| Jan. 31 | 5.5% | Bush took office |
| March 20 | 5.0% | Recession |
| April 18 | 4.5% | No notable event |
| May 15 | 4.0% | No notable event |
| June 27 | 3.75% | EGTTRA tax rebate enacted |
| Aug. 21 | 3.5% | No notable event |
| Sept. 17 | 3.0% | 9/11 attacks |
| Oct. 2 | 2.5% | Afghanistan War |
| Nov. 6 | 2.0% | Recession ended |
| Dec. 11 | 1.75% | No notable event |
The GDP was 1.7% in 2002, unemployment was 6.0%, and inflation was 1.6%. The following tables have data taken from The Federal Reserve.
| Date | Fed Funds Rate | Event |
|---|---|---|
| Nov. 6 | 1.25% | Fed lowered rates to fight sluggish growth |
In 2003, the GDP was 2.8%, unemployment was 5.7%, and inflation was 2.3%.
| Date | Fed Funds Rate | Event |
|---|---|---|
| June 25 | 1.00% | JGTRRA tax cuts enacted to spur growth |
In 2004, the GDP was 3.9%, unemployment was 5.4%, and inflation was 2.7%.
| Date | Fed Funds Rate | Event |
|---|---|---|
| June 30 | 1.03% | Low rates pushed interest-only loans |
| Aug. 10 | 1.5% | No notable event |
| Sept. 21 | 1.75% | No notable event |
| Nov. 10 | 2.0% | No notable event |
| Dec. 14 | 2.25% | No notable event |
In 2005, the GDP was 3.5%, unemployment was 4.9%, and inflation was 3.4%.
| Date | Fed Funds Rate | Event |
|---|---|---|
| Feb. 2 | 2.5% | No notable event |
| March 22 | 2.75% | No notable event |
| May 3 | 3.0% | No notable event |
| June 30 | 3.25% | No notable event |
| Aug. 9 | 3.5% | No notable event |
| Sept. 20 | 3.75% | No notable event |
| Nov. 1 | 4.0% | No notable event |
| Dec. 13 | 4.25% | No notable event |
Fed Chair Ben Bernanke (February 2006-January 2014)
In 2006, the GDP was 2.8%, unemployment was 4.4%, and inflation was 3.2%.
| Date | Fed Funds Rate | Event |
|---|---|---|
| Jan. 31 | 4.5% | Raised to cool housing market bubble |
| March 28 | 4.75% | Higher rates caused more mortgage defaults |
| May 10 | 5.0% | No notable event |
| June 29 | 5.25% | No notable event |
In 2007, GDP was 2.0%, unemployment was 5.0%, and inflation was 2.8%.
| Date | Fed Funds Rate | Event |
|---|---|---|
| Sept. 18 | 4.75% | Home sales fell |
| Oct. 31 | 4.5% | No notable event |
| Dec. 11 | 4.25% | LIBOR rose; stock market peaked; recession began |
In 2008, The GDP was 0.1%, unemployment was 7.3%, and inflation was 3.8%. As of Dec. 16, 2008, the target funds rate became a range, represented in the tables by the upper limit.
| Date | Fed Funds Rate | Event |
|---|---|---|
| Jan. 22 | 3.5% | No notable event |
| Jan. 30 | 3.0% | No notable event |
| March 18 | 2.25% | Bear Stearns bailout |
| April 30 | 2.0% | No notable event |
| Oct. 8 | 1.5% | Lehman fails; bank bailout approved |
| Nov. 29 | 1.0% | AIG bailout |
| Dec. 16 | 0.25% | Effectively zero |
The Fed kept the rate at zero between 2008 and 2015. The recession ended in June 2009.
Fed Chair Janet Yellen (February 2014-February 2018)
In 2015, GDP was 2.3%, unemployment was 5.0%, and inflation was 0.1%.
| Date | Fed Funds Rate | Event |
|---|---|---|
| Dec. 17 | 0.50% | Growth stabilized; Fed began raising rates |
In 2016, the GDP was 1.7% in 2016, unemployment was 4.7%, and inflation was 1.3%.
| Date | Fed Funds Rate | Event |
|---|---|---|
| Dec. 15 | 0.75% | Fed maintained steady increase in rates |
In 2017, the GDP was 2.3%, unemployment was 4.1%, and inflation was 2.1%.
| Date | Fed Funds Rate | Event |
|---|---|---|
| March 16 | 1.00% | Continued raising rates |
| June 15 | 1.25% | No notable event |
| Dec. 14 | 1.5% | No notable event |
Fed Chair Jerome Powell (Since February 2018)
In 2018, the GDP was 2.9%, unemployment was 3.9%, inflation was 2.4%.
| Date | Fed Funds Rate | Event |
|---|---|---|
| March 22 | 1.75% | No notable event |
| June 14 | 2.00% | No notable event |
| Sept. 27 | 2.25% | No notable event |
| Dec. 20 | 2.50% | Fed promised to stop raising rates |
In 2019, the GDP was 2.3%, unemployment was 3.5%, and inflation was 1.9%.
| Date | Fed Funds Rate | Event |
|---|---|---|
| Aug. 1 | 2.25% | Lowered rates despite growth |
| Sept. 19 | 2.00% | Fed was concerned about slowing growth |
| Oct. 31 | 1.75% | Slow global growth and muted inflation |
In 2020, the GDP decreased 3.4%, inflation was 1.2%, and unemployment was 6.7%.
| Date | Fed Funds Rate | Event |
|---|---|---|
| March 3 | 1.25% | Coronavirus pandemic |
| April 29 | 0.25% | Effectively zero |
| June 10 | 0.25% | Effectively zero |
| July 29 | 0.25% | Effectively zero |
| Sept. 16 | 0.25% | Effectively zero |
| Nov. 5 | 0.25% | Effectively zero |
| Dec. 16 | 0.25% | Effectively zero |
In 2021, GDP increased by 6.9%, the largest one-year jump since 1984; on the other hand, inflation also increased by 7%, the largest increase since 1982.
| Target Federal Funds Rates for 2021 | ||
|---|---|---|
| Date | Fed Funds Rate | Event |
| Jan. 27 | 0.25% | Effectively zero |
| March 17 | 0.25% | Effectively zero |
| April 28 | 0.25% | Effectively zero |
| June 16 | 0.25% | Effectively zero |
| July 28 | 0.25% | Effectively zero |
| Sept. 22 | 0.25% | Effectively zero |
| Nov. 4 | 0.25% | Effectively zero |
| Dec. 15 | 0.25% | Effectively zero |
This information is pulled from the Federal Reserve when it releases the monetary policy stance of the Federal Open Market Committee (eight times a year).
Source link