
British Pound, GBP/USD, Crude Oil, GOLD, AUD, NZD, CAD, NOK, JPY, CHF – Talking Points
- The British Pound has stood firm as markets swirl in volatility
- Equity markets recover from sell off on news of US-Russia talks
- Cable has rallied through the carnage, can GBP/USD continue higher?
Sterling has held up quite well in the face of heightened geopolitical uncertainty that has engulfed markets.
The situation in the Ukraine continues to roil markets with the Nasdaq down 2.88% in the cash session. The red ink spilled down Wall Street and across the Pacific with APAC equities initially going south.
However, in the Asian session news came out from the White House that the US and Russia are to meet next week for talks. This saw Asian equities recover and has US equity futures pointing toward a positive start on their open.
Likewise, other risk assets that had been sold off, managed to recover through the day. As a result, AUD, CAD, NOK and NZD rallied while JPY, CHF and USD softened.
Gold had a look above US$ 1,900 an ounce and was eyeing off June’s high of US $1,916 before the turn in sentiment saw it slide back toward US$ 1,890.
Crude oil remains a little sluggish with the WTI futures contract trading around US$ 91 bbl after post a high of US$ 95.82 to start the week. The market continues find relief from a potential deal being done with Iran to gain an extra 900,000 bbl a day by December.
Bond yields were softer overnight as investors bought high grade debt. 10-year Treasuries initially headed to 1.95% but has since bumped up a few basis points on the US-Russia talks news.
After UK retail sales and French CPI this morning, the US will see new homes sales and the leading index data, while Canada will get retail sales numbers. There are also a number of ECB and Fed speakers to look out for that will be crossing the wires today.
GBP/USD Technical Analysis
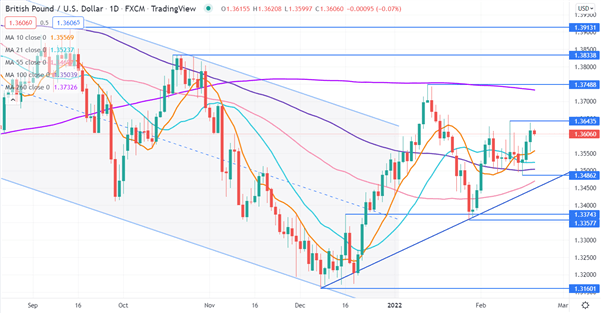
After making a low in December GBP/USD has consolidated higher and broken above a descending trend channel. It has more recently held above several simple moving averages (SMA).
While it is above the 10, 21, 55 and 100-day SMAs, it is still someway from approaching the longer term 260-day SMA. This could suggest that bullish momentum is unfolding but is yet to be fully confirmed.
Resistance might be at the previous highs of 1.36435, 1.37488, 1.38338 and 1.39131.
On the downside, support may lie at previous lows of 1.33577 and 1.31601 or the pivot point at 1.33743.
— Written by Daniel McCarthy, Strategist for DailyFX.com
To contact Daniel, use the comments section below or @DanMcCathyFX on Twitter
Buka akaun dagangan patuh syariah anda di Weltrade.
Source link