The pair will likely keep rising as bulls target the next neckline of the H&S pattern.
Bullish View
- Buy the BTC/USD pair and set a take-profit at 45,820.
- Add a stop-loss at 43,500.
- Timeline: 1-2 days.
Bearish View
- Set a sell-stop at 43,800 and a take-profit at 42,500.
- Add a stop-loss at 44,500.
The BTC/USD pair bounced back as market risks eased. The pair rose to a high of 44,406, which was the highest level since February 10th. This price is about 33% above the lowest level this year. The jump brings its total market cap to more than $833 million.

Bitcoin Rebounds
Bitcoin and other cryptocurrency prices rose sharply on Tuesday as worries about Ukraine appeared to ease. The rebound coincided with the sharp rally of stocks. The Nasdaq 100 index rose by more than 230 points while the Dow Jones rose by 335 points on Tuesday. At the same time, assets that rallied during the tension period like gold and crude oil declined sharply.
In the past few months, there have been a close correlation between American equities and Bitcoin. This correlation has happened mostly because of the Federal Reserve. Inflation data published on Tuesday showed that producers continued to experience elevated prices.
Therefore, investors believe that the Fed will continue embracing a hawkish tone in the next few months. Precisely, analysts expect that the bank will hike interest rates at least three times this year. Still, the biggest challenge for the Fed will be on how to hike interest rates without slowing the economic recovery.
The retail sales numbers scheduled for later today will show whether the recovery is continuing. Economists expect the data to show that the headline and core sales made a modest recovery in January even as prices remained at elevated levels.
Data compiled by Messari shows that activity in Bitcoin’s ecosystem is still strong. For example, the number of transactions in the past 24 hours rose to $33.6 billion even as the hash rate declined slightly.
BTC/USD Forecast
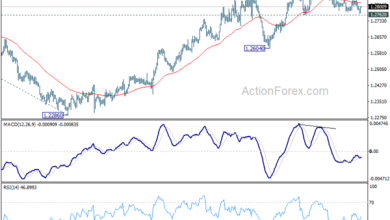
The four-hour chart shows that the BTC/USD pair has been in a strong bullish trend in the past few days. Along the way, the pair has managed to move above the 25-day and 50-day moving averages. It has also formed an inverted head and shoulders pattern whose neckline is at 45,820.
The Stochastic Oscillator has moved above the overbought level. Therefore, the pair will likely keep rising as bulls target the next neckline of the H&S pattern. This view will be invalidated if it moves below the support at 41,625.

Source link