Year of Distortions, Shortages, Massive Inflation, Worst Trade Deficits Ever, and Hyper-Stimulated Growth Ends with a Bang
But companies were finally able to rebuild some woefully low inventories in Q4.
By Wolf Richter for WOLF STREET.
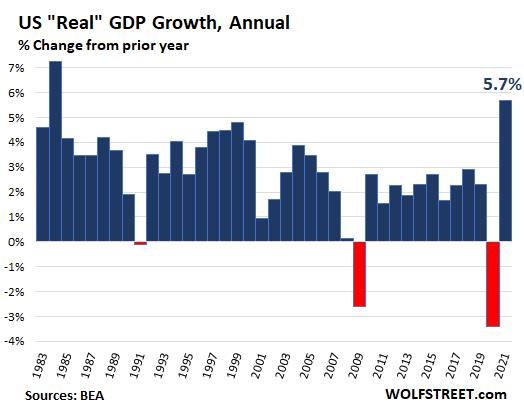
GDP is adjusted for inflation to get “real” GDP by expressing everything in “chained 2012 dollars.” In this manner, real GDP in all of 2021 jumped to $19.43 trillion, up by 5.7% from a year earlier, the fastest annual growth since 1984, according the Bureau of Economic Analysis today.
This was a historic year, in terms of inflation, hyper-stimulated economic growth, trade deficits, and distortions, such as the labor and materials shortages. In the decade from 2010 through 2019, annual real GDP growth averaged 1.9% and never quite reached 3% in any single year. A range between 2% and 3% growth is now considered good and sustainable for the US economy – without running into the distortions now bedeviling the economy, where business are hobbled by not being able to get what they need, and consumers are confronted with some empty shelves, nearly empty lots at new vehicle dealers, and soaring prices.
In actual or “current” dollars, not “chained 2012 dollars,” GDP — “nominal GDP” — in all of 2021 jumped by 10.0% year-over-year to $24.0 trillion.
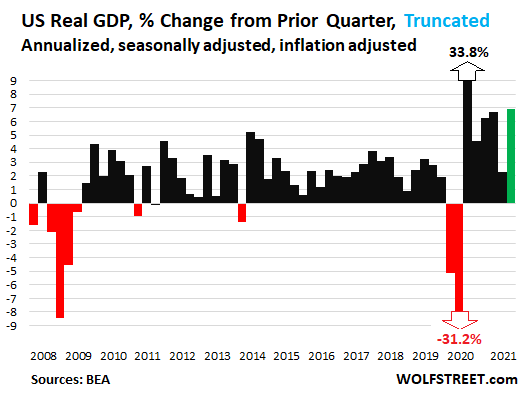
In the 4th quarter, “real” GDP, expressed in 2012 dollars, jumped by a seasonally adjusted annual rate of 6.9%. For a better view of the details, I truncated the two historic outliers, the 31.2% plunge in Q2 2020 and the 33.8% spike in Q3 2020:
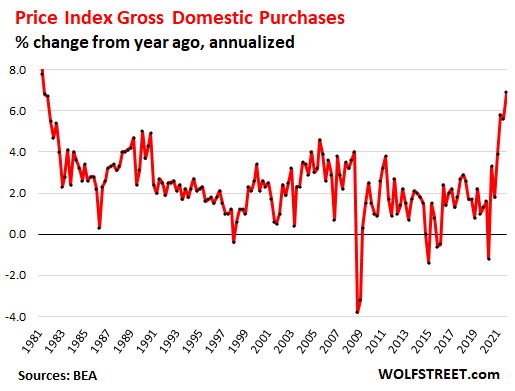
Rampant Inflation on the loose: The Price Index for Gross Domestic Purchases, the BEA’s inflation measure that roughly parallels its inflation adjustments to GDP, spiked in Q4 by an annualized rate of 6.9%, the worst inflation since Q2 1981. This is why the Fed is getting serious about inflation:
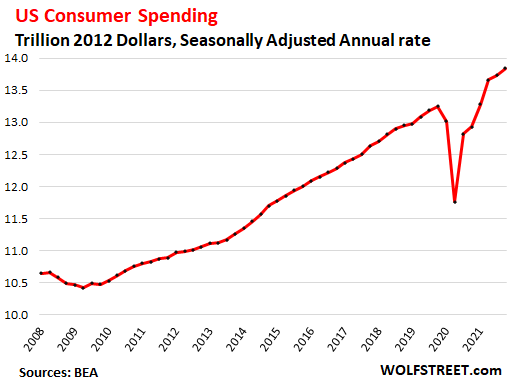
Consumer spending rose by an annual rate of 3.3% in Q4, adjusted for inflation. This was at the higher end of the normal range before the pandemic, after much of the stimulus money sent directly to consumers was spent and new flows largely ended.
Consumer spending as a percent of total GDP, at 69.9% in Q4, has now returned to below 70%, after two historic quarters above 70%.
Consumer spending was still hampered in part by shortages of goods to buy, particularly a biggie: new vehicles. And spending on goods edged up by only 0.5% (annualized). But consumers made up for it by buying more services, where spending jumped by 4.7%.
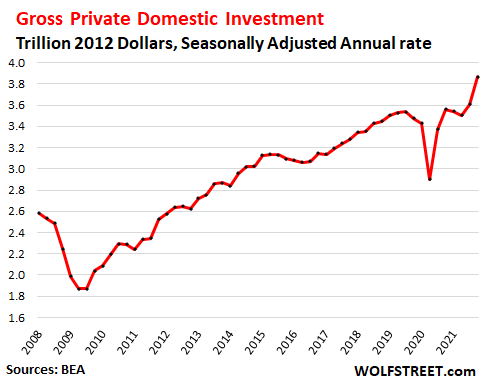
Gross private domestic investment soared by 32% (annualized), to a seasonally adjusted annual rate of $3.87 trillion. This category includes fixed investments, such as nonresidential structures, equipment, intellectual property, and residential structures. And it includes “change in private inventories,” and more on that in a moment.
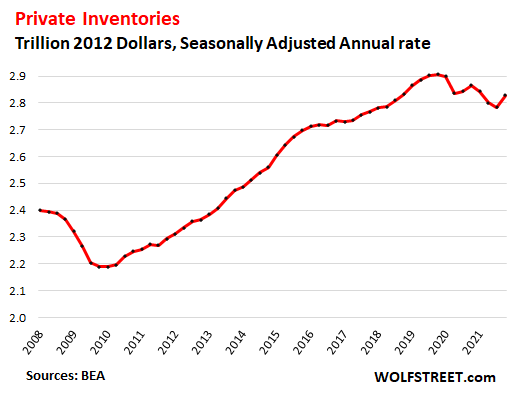
Private inventories finally rose, after having dropped for the first three quarters of 2021, leading to the shortages that businesses and consumers have encountered. As we have seen with new and used vehicles, industries were able to rebuild little by little their inventories, though in many industries, including the new vehicle industry, they remain woefully low.
In Q4, private inventories jumped by $240 billion annualized rate to $2.83 trillion. A rise in private inventories is considered an investment and thereby increases GDP, while a drop in inventories reduces GDP. After having dogged GDP for the prior three quarters, inventories finally added some oomph – and there is likely more to come in 2022, as companies are trying to rebuild their inventories:
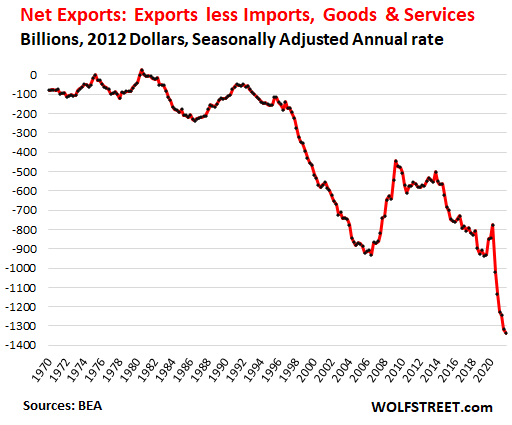
The Trade Deficit in goods and services worsened by 6.7% (annualized) to a new worst record of $1.34 trillion annual rate.
Exports add to GDP, imports reduce GDP. “Net exports” (exports minus imports) deteriorated due to soaring imports, which were fueled by consumer spending on durable goods.
Since Q1 2020, the huge amounts of stimulus sent directly to consumers and provided by the Fed via asset price inflation has stimulated the big exporters outside the US. The relatively small dip in Q4 shows that either stimulus has worn off or that consumers had trouble buying imported goods due to the supply-chain chaos, or both.
The chart is an indictment of globalization over the past three decades, committed by Corporate America:
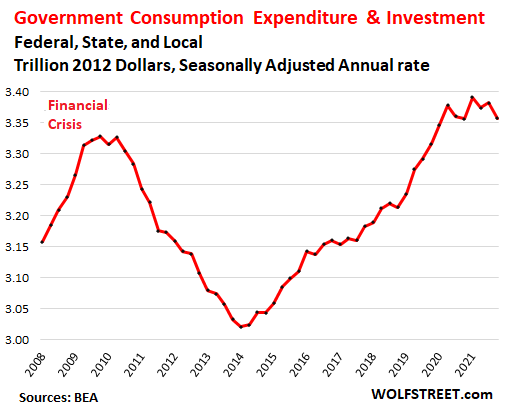
Government consumption and investment declined 2.9% (annualized), split up by a 4.0% decline by the federal government and a 2.2% decline by state and local governments.
Government consumption and investment does not include transfer payments to consumers and companies, such as stimulus payments, unemployment payments, Social Security payments; nor does it include government salaries, and other direct payments to consumers. Those payments enter GDP when consumers and businesses spend or invest this money.

Enjoy reading WOLF STREET and want to support it? Using ad blockers – I totally get why – but want to support the site? You can donate. I appreciate it immensely. Click on the beer and iced-tea mug to find out how:

Would you like to be notified via email when WOLF STREET publishes a new article? Sign up here.
![]()
Source link