Start the week of January 17, 2022 with our Forex forecast focusing on major currency pairs here.
The yen is a popular asset during turbulent times.
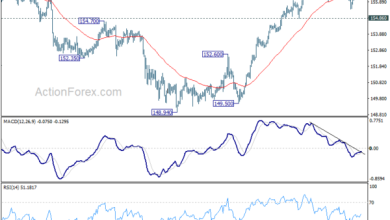
USD/JPY
The US dollar plummeted against the Japanese yen but did recover slightly during the Friday session. At this point, it looks as if there is a lot of selling pressure, so I think if we do rally at this point, a significant amount of resistance may cause some issues. At the first signs of exhaustion, I anticipate that there will be a lot of traders out there willing to short this market. That being said, the ¥112.50 level underneath should be a significant support level. To the upside, keep an eye on ¥115, because it is so important.

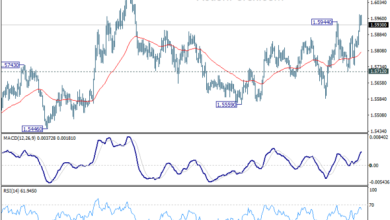
EUR/USD
The euro had a wild week, as it initially fell towards the 1.1250 level before turning right back around. We got an explosive move to the upside as we sliced through the 1.14 handle, and then went racing all the way to the 1.15 level above. The 1.15 level is a psychologically important area, and we saw the US dollar strengthen late in the week. Because of this, the euro took it on the chin. At this point, the question is whether or not the area just underneath the 1.14 level will hold as support. If it does, then it might be a buying opportunity, but if we break down below the 1.1366 level, it is likely that we would break down.

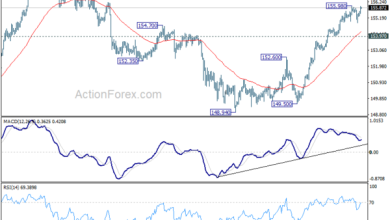
AUD/USD
The Australian dollar rallied most of the week, reaching towards the 0.73 level, but we ended up breaking down significantly to form a bit of a shooting star for the week. That is a negative sign, and it looks like we are going to continue the overall negativity that we have seen in this market. Because of this, it would not surprise me to see a “sell the rallies” type of situation, or perhaps just a break down towards the 0.70 level.

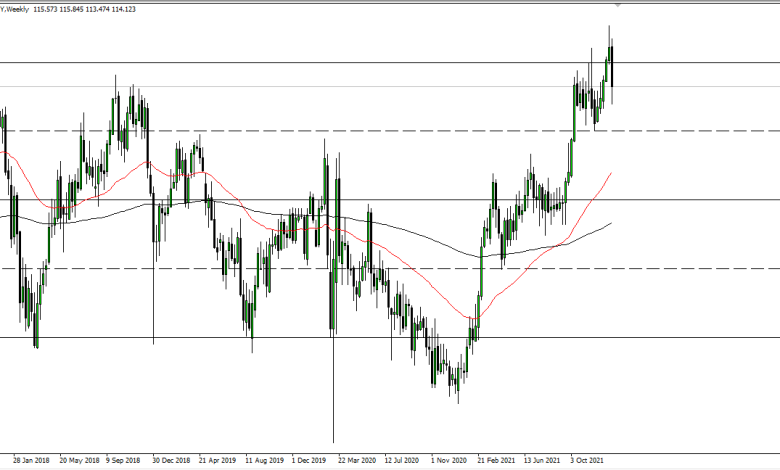
AUD/NZD
The Australian dollar rallied against the New Zealand dollar again during the course of last week, but as we have seen over the last month, every time it does that, there are sellers to push the market back down. At this point, if we break down below the 1.0550 level, I anticipate that we will have a continuation of the longer-term downward pressure. That being said, if we can break above the 200 week EMA, that would confirm the “W pattern” that we had just formed and would be extraordinarily bullish.

Source link