The Most Splendid Housing Bubbles in America, January Update: Starting to Look Like a Mixed Bag
Raging mania in Phoenix, stalling prices in Boston & Washington DC, dropping condo prices in San Francisco.
By Wolf Richter for WOLF STREET.
House prices spiked further in some cities, including by a crazy 32% year-over-year in Phoenix. In other cities, price increases slowed. In the Boston metro, house prices remained flat for the second month in a row. And in the San Francisco metro, condo prices fell for the third month in a row. That’s the range, according to the S&P CoreLogic Case-Shiller Home Price Index today.
The overall National Index ticked up 0.9% for the month, whittling down the year-over-year increase to a still ridiculous 18.8%, the smallest increase since June. “Slows further,” is how S&P CoreLogic described this situation. The time frame: today’s “November” data are a three-month moving average of closed sales that were entered into public records in September, October, and November.
Los Angeles metro: Prices of single-family houses rose 1.2% in November from October, and by 19.0% year-over-year:
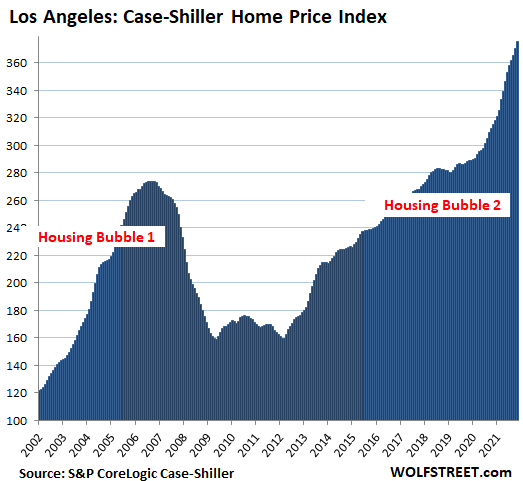
The Case-Shiller Indices were set at 100 for January 2000. The Los Angeles index value of 375 means that prices in the metro have risen by 275% since January 2000, including the Housing Bust in between. By comparison, over the same period, the Consumer Price Index (CPI) is up by 65%.
This 275% price surge since January 2000 makes Los Angeles the Number 1 most splendid housing bubble on this list. But there are other metros on this list where prices have spiked much faster on a year-over-year basis in 2021. The charts below are on the Los Angeles scale to show the relative house price inflation in each market.
San Diego metro: The Case-Shiller Index rose 1.0% for the month, cooling somewhat from the month-to-month spikes of over 3% last spring. Year-over-year, house prices spiked by 24.4%, just a tad down from 27.8% in July. Since 2000, the index has ballooned by 268%:
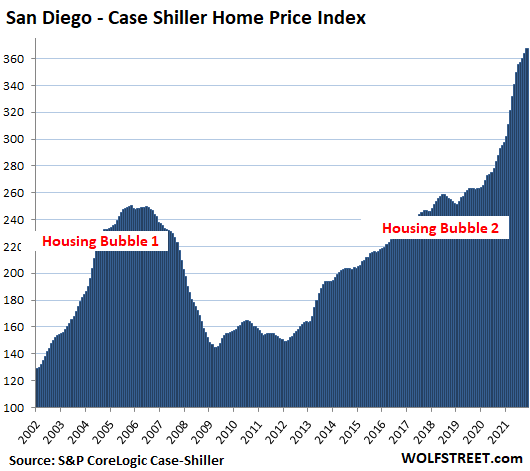
The dollar is losing purchasing power with regards to houses. The Case-Shiller Index is based on the “sales pairs method,” comparing the sales price of a house when it sells in the current period to the price of the same house when it sold previously. It includes adjustments for home improvements and the passage of time since these sales pairs can be decades apart. By tracking the price of the same house, it tracks how many dollars it takes to buy the same house over time, thereby tracking the loss of the purchasing power of the dollar with regards to houses. In other words, it tracks house price inflation.
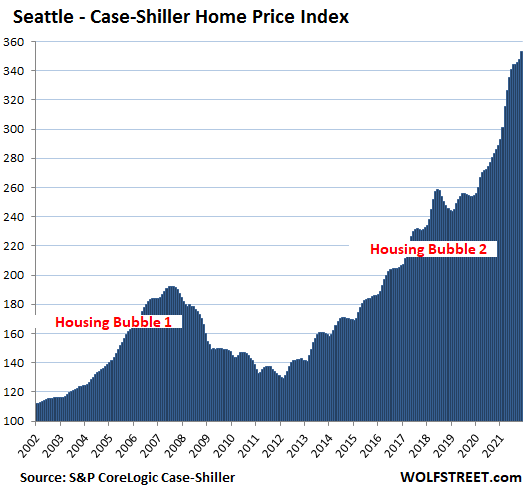
Seattle metro: House prices jumped 1.4% in November from October, and by 23.3% year-over-year, down a tad from July’s 25.5% spike. Since January 2000, the index has soared 253%:
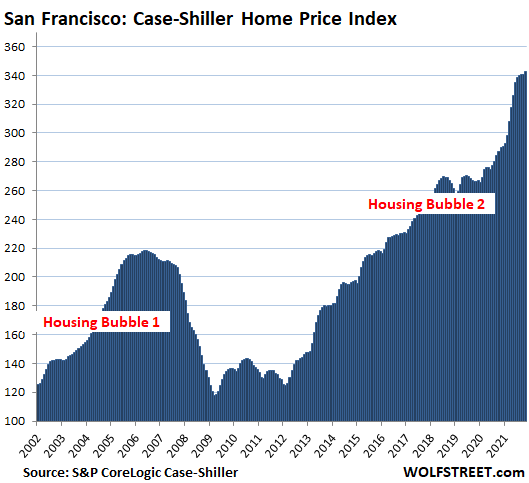
San Francisco Bay Area: House prices rose 0.6% for the month, after having stalled for three months in a row. This whittled down the year-over-year spike to 18.2%, the slowest year-over-year spike since April:
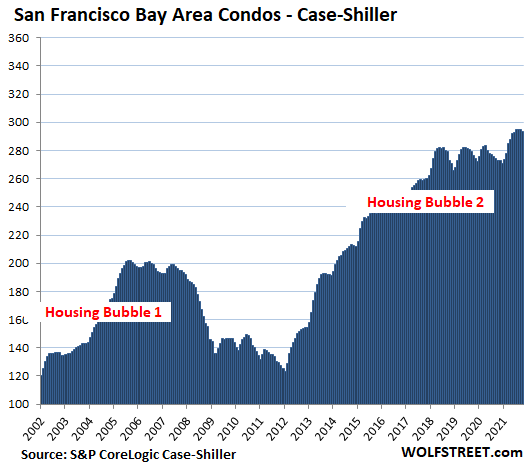
San Francisco Bay Area: Condo prices fell 0.3% for the month, the third month in a row of declines. For the past six months, prices have gone essentially nowhere. This reduced the year-over-year gain to 7.7%. Since June 2017, condo prices have risen just 4.1%:
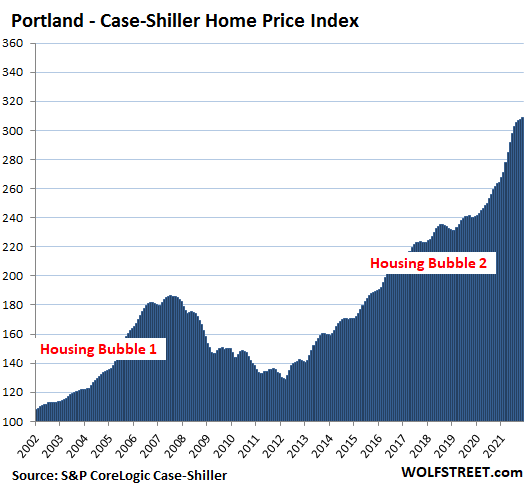
Portland metro: House prices rose by 0.5% for the month, and by 17.4% year-over-year. This is down from peak-heat in July of 19.5%:
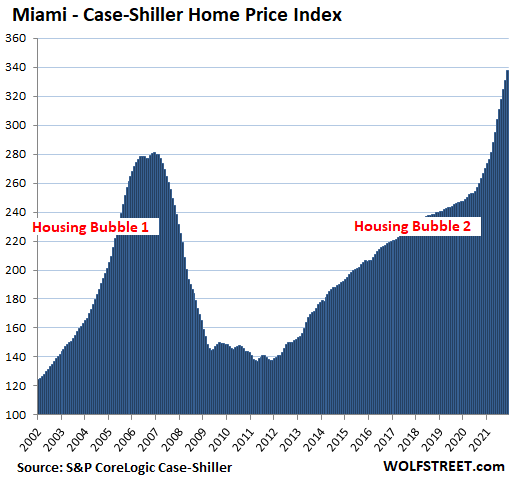
Miami metro: House prices spiked by 2.0% for the month, with no “slowing further” thingy going on here. Year-over-year, prices spiked by 26.6%, the fastest since March 2006, on the eve of the Housing Bust:
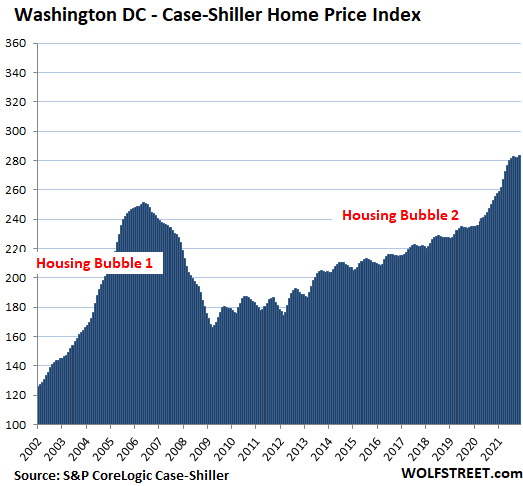
Washington D.C. metro: House prices rose 0.5% for the month, after two months of slight declines. This trimmed the year-over-year gain to 11.1%, the slowest since February, and developing a flat spot on top, the first since 2019
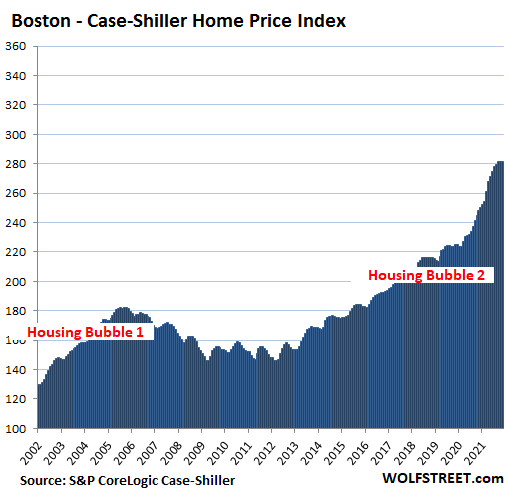
Boston metro: House prices were flat for the second month in a row, which trimmed the year-over-year gain to 13.5%, from 18.7% in July, and created the first flat spot since the second half of 2019:
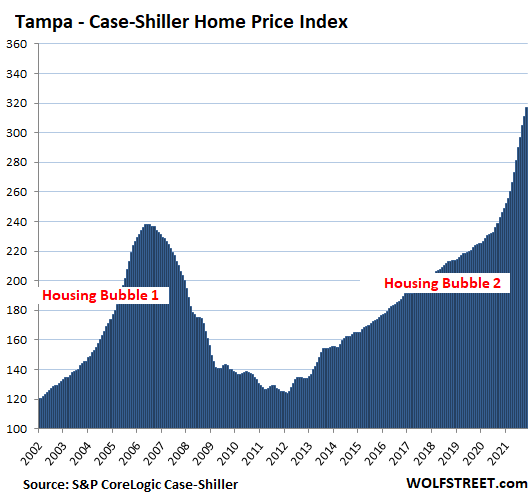
Tampa metro: +2.1% for the month, and +29.0% year-over-year, a new record year-over-year spike in this market, out-spiking the craziness during Housing Bubble 1:
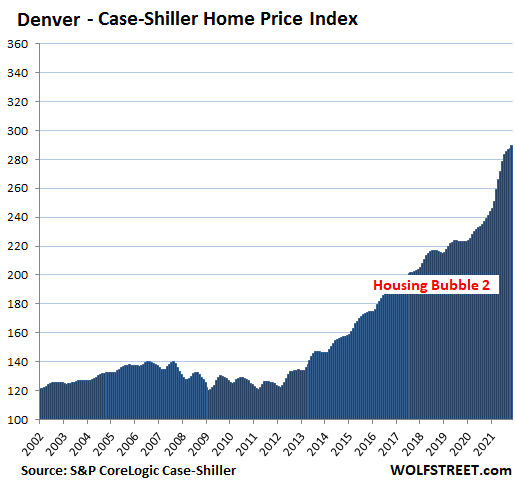
Denver metro: +0.8% for the month, which whittled down the year-over-year spike to 20.1% (from a peak of 21.5% in August):
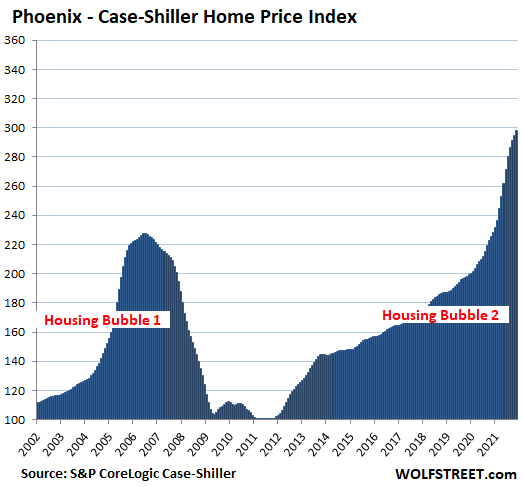
Phoenix metro: +1.2% for the month. November and October had the slowest month-to-month spikes since July 2020. Year-over-year: +32.2%, out-spiking the peak of Housing Bubble 1, and the red-hottest spike in this line-up of the most splendid housing bubbles:
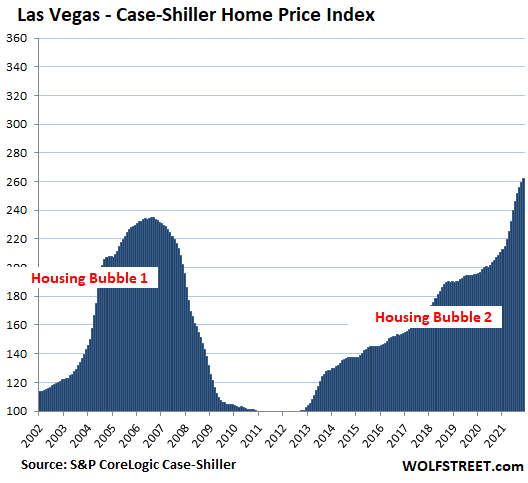
Las Vegas metro: +0.9% for the month, the slowest spike since November 2020, and down from peak-heat in June of 3.4%. Year-over-year: +25.7%.
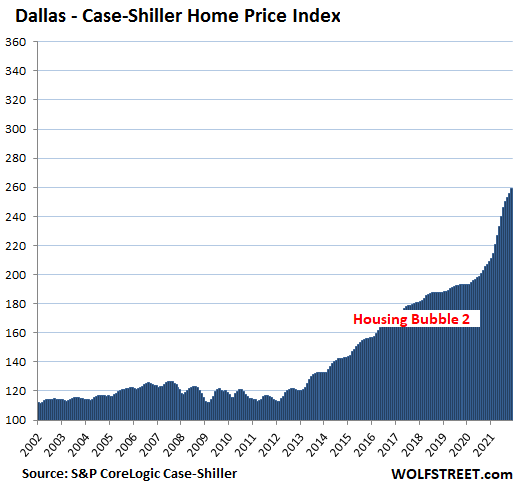
Dallas metro: +1.2% for the month, +25.0% year-over-year. .
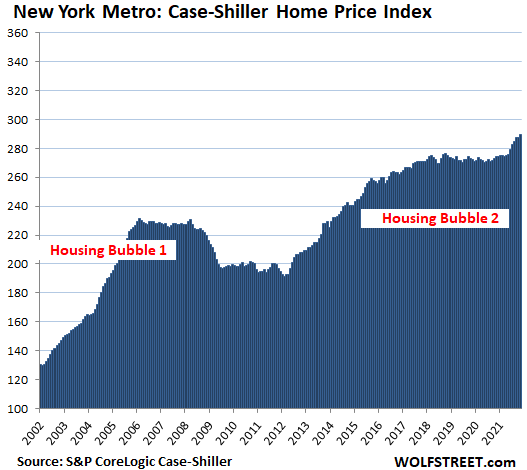
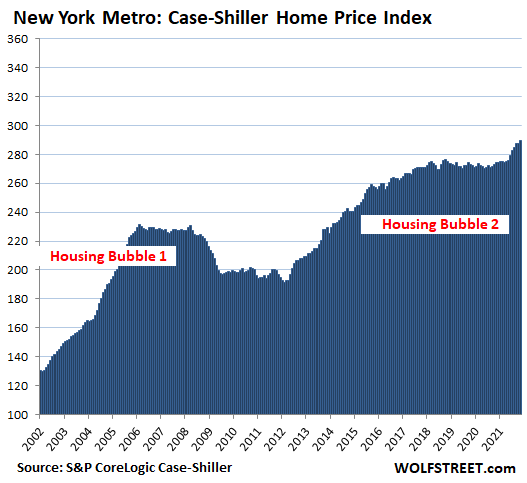
New York metro – what Case-Shiller calls the “New York Commuter” consisting of New York City plus numerous counties in the states of New York, New Jersey, and Connecticut from which people commute, or used to commute into the City.
House prices +1.0% for the month, trimming down the year-over-year gain to 13.8%, the lowest since March. The index is up 151% since 2000.
The remaining metros in the 20-metro Case-Shiller Index – Atlanta, Charlotte, Chicago, Cleveland, Detroit, and Minneapolis – have house price inflation since 2000 that has been substantially less than 150%, and so they don’t yet qualify for this list of the most splendid housing bubbles.
Enjoy reading WOLF STREET and want to support it? Using ad blockers – I totally get why – but want to support the site? You can donate. I appreciate it immensely. Click on the beer and iced-tea mug to find out how:

Would you like to be notified via email when WOLF STREET publishes a new article? Sign up here.
![]()
Source link