
This analysis focuses on gold and silver within the Comex/CME futures exchange. See the article What is the Comex? for more detail. The charts and tables below specifically analyze the physical stock/inventory data at the Comex to show the physical movement of metal into and out of Comex vaults.
Registered = Warrant assigned and can be used for Comex delivery, Eligible = No warrant attached – owner has not made it available for delivery.
Current Trends
Gold
The outflows in gold have continued after a brief increase in December. Stocks have decreased 225k ounces in January so far and 442k since the last stock report. Gold outflows persisted at a fairly steady clip for the year, with 8 of the last 10 months showing net outflows.
Deliveries have started increasing again, so it will be interesting if this translates to investors taking their gold out of the Comex vaults. January is looking to be another big month of deliveries relative to recent minor months. A detailed report will be released later this week.
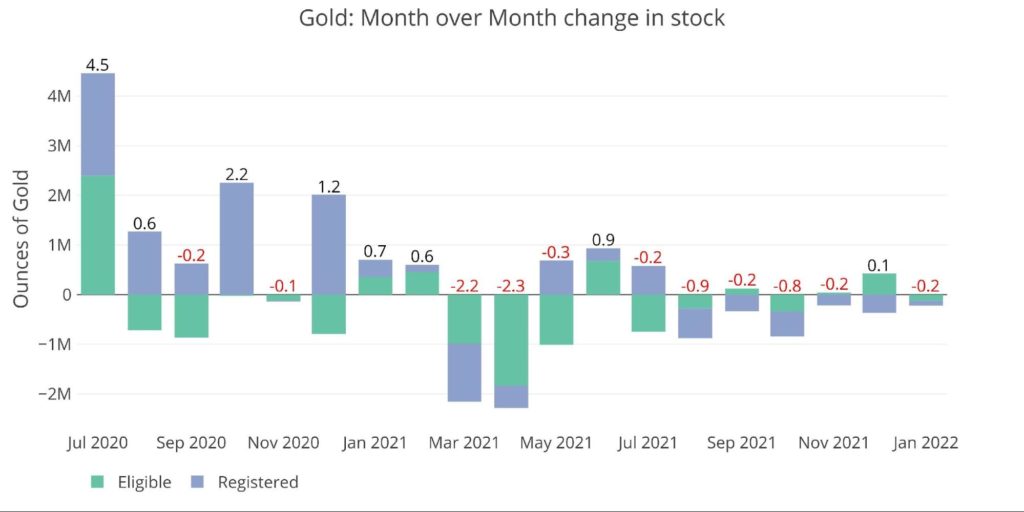
Figure: 1 Recent Monthly Stock Change
The chart below shows the daily activity since the last report. Investors are moving metal from Registered back to Eligible (they don’t want the metal available for delivery). They have also been removing it from Eligible, straight out of the vaults.
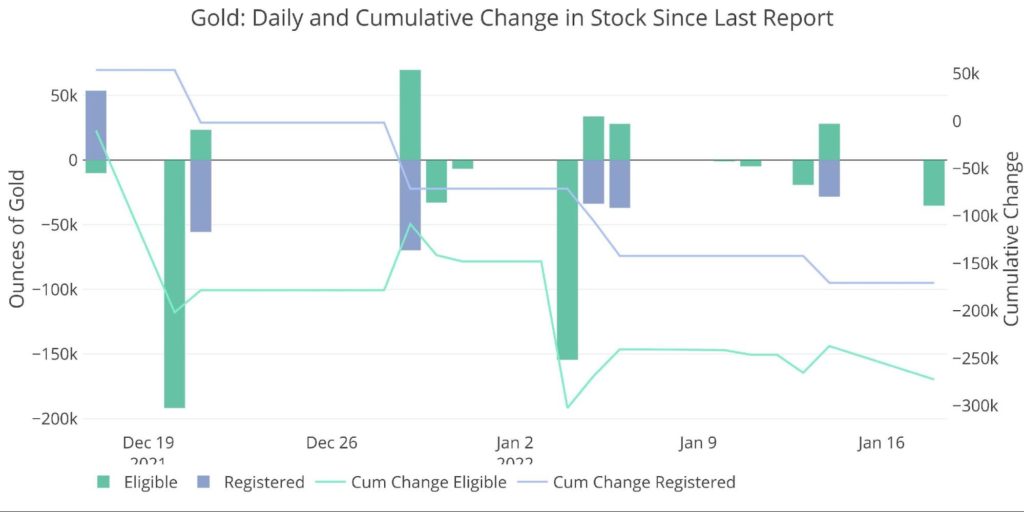
Figure: 2 Recent Monthly Stock Change
Silver
The trend of Registered flowing into Eligible was magnified in silver for the month of December. Nearly 17M ounces of silver were taken out of Registered and back to Eligible. Despite a slight increase in total inventory in December of 3.6M ounces, January has already seen 2.6M ounces leave the vault.
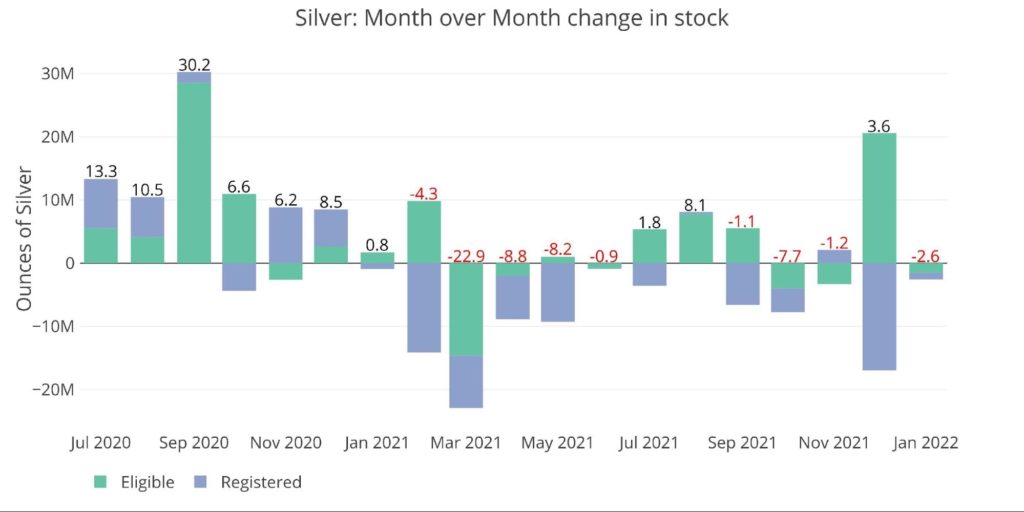
Figure: 3 Recent Monthly Stock Change
Looking at the detailed report shows large activity right into year-end. More than 10M ounces moved from Registered back to Eligible in the last two trading days of 2021. Activity has been much quieter since then.
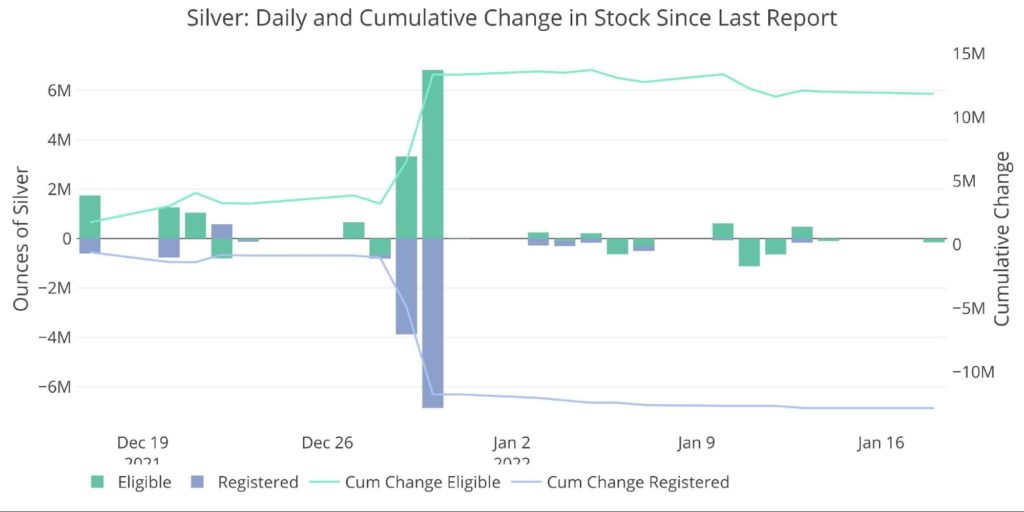
Figure: 4 Recent Monthly Stock Change
The table below summarizes the movement activity over several time periods.
Gold
- 2021 has seen a major fall in supply after the vaults rushed to increase their positions in the wake of the liquidity crunch from Covid. Gold has seen stocks deplete by 2.4M ounces which represent about 6.5% of the balance one year ago.
- As of last month, Eligible had seen the bulk of the move, but due to recent activity, Registered depletion now represents 40% of total net drawdowns.
- 18% of the total drawdown has occurred in the last 30 days
Silver
- Silver has seen stock deplete by 44M ounces over the last year or 11.1%.
- This is concentrated entirely in Registered with a third of the loss actually going back to Eligible
- The activity over the last month which saw 12.8M ounces leave Registered and 11.8M flow into Eligible is a huge move
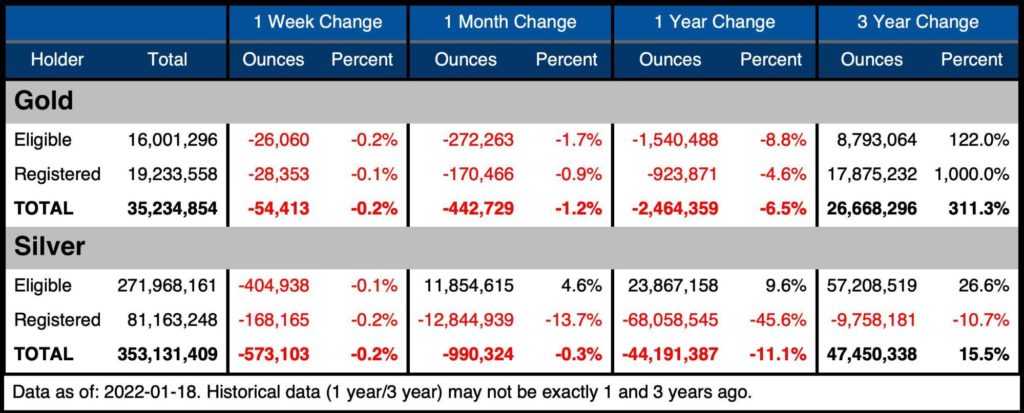
Figure: 5 Stock Change Summary
The next table shows the activity by bank/Holder. It details the numbers above to see the movement specific to vaults.
Gold
- Over the last month, no vaults added to inventory
- Over the last year, only Loomis has seen a modest increase in inventory
- Every other vault has seen substantial outflows.
- Brink’s led the way with nearly 1.4M ounces leaving the inventory (13.1%)
Silver
- The movement is more mixed than in gold. Some vaults added over the last year while others saw outflows.
- Manfra took their holdings up 10x from 2M up to 22M
- The same mixed bag holds true on the monthly level
- CNT added almost 1M ounces after seeing stocks decline by 27.7M ounces (46.3%) over the last year
- Despite the shuffling, the aggregate move is still 44M ounces out of the vault
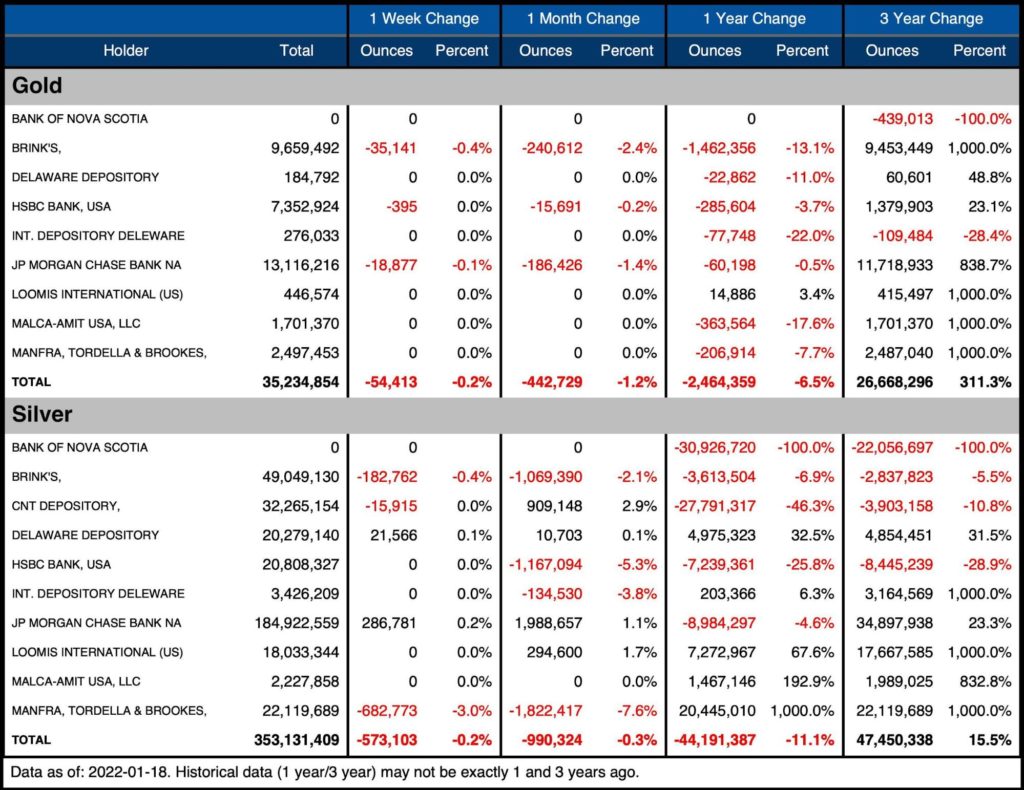
Figure: 6 Stock Change Detail
Historical Perspective
Zooming out and looking at the inventory for gold and silver since 2016 shows the impact that Covid had on the Comex vaults. Gold had almost nothing in the Registered category before JP Morgan and Brinks added their London inventory with nearly 20M ounces.
In fact, delivery in Dec 2019 was exactly 1.47M ounces. At the same time, on Dec 10, 2019, the total Registered stood at exactly 1.47M. This was up from 1.1M ounces on Nov 24, 2019. That means the entire pool of Registered turned over in a single month. In order to meet the demand, metal had to be moved from Eligible. Since then, the vaults have given themselves much more wiggle room as shown below in orange.
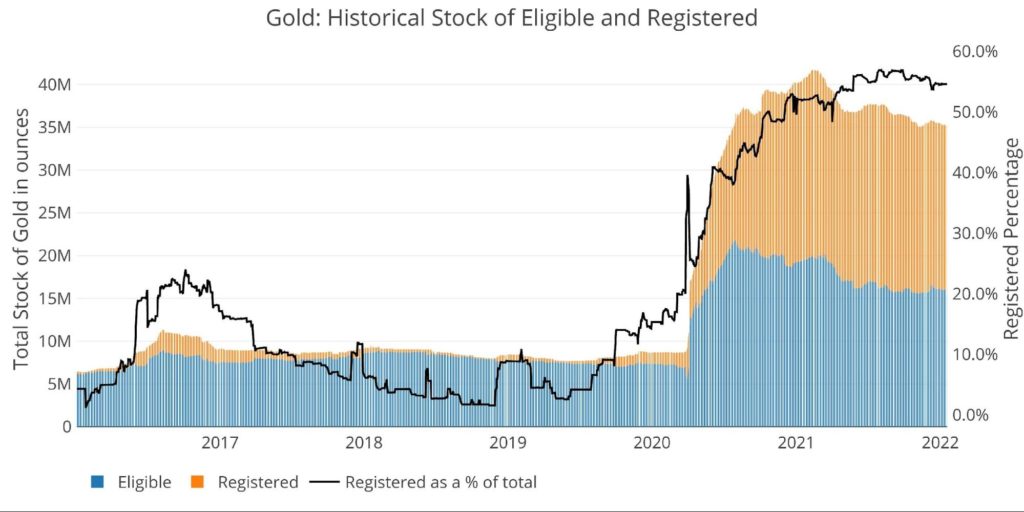
Figure: 7 Historical Eligible and Registered
Silver also saw an increase in Registered around March 2020, but this has been draining much more steadily back to pre-Covid levels.
The latest move at the end of December can be seen with a massive drawdown in Registered as a % of total (black line below). The percentage now sits at 23%, the lowest since April 2018. This indicates fewer people making their metal available for delivery. Investors keeping metal as Eligible indicates they want to hold onto the silver!
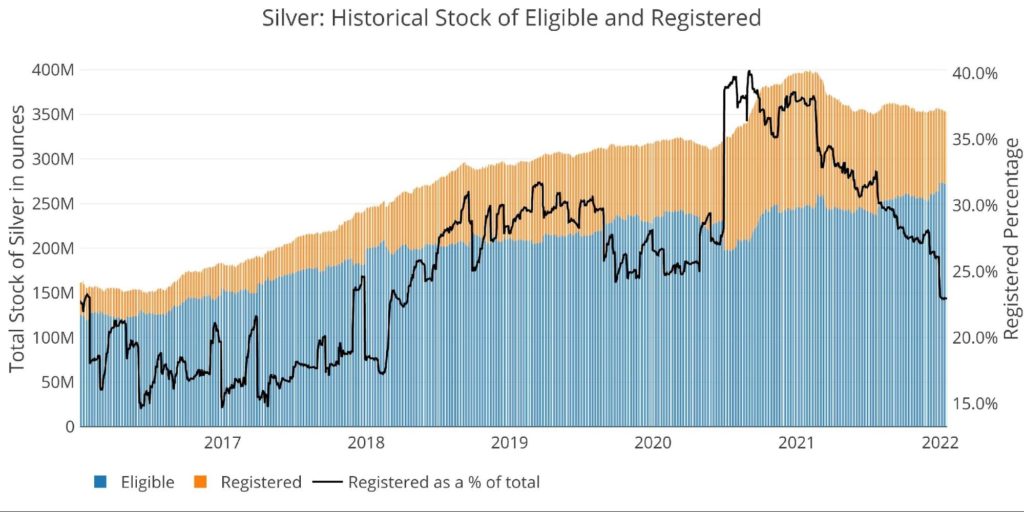
Figure: 8 Historical Eligible and Registered
Available supply for potential demand
Many critics point to the massive open interest compared to available inventory at the Comex. As can be seen in the chart below, the ratio of open interest to total stock has fallen from over 8 to 1.5. In terms of Registered (available for delivery against open interest), the ratio collapsed from nose bleed levels (think Nov 2019 where 100% stood for delivery) down to 2.84 in the latest month.
This ratio saw a recent uptick as open interest in gold increased recently alongside falling inventory. The move has not (yet) been as large as the uptick in November when gold surged above $1870 briefly.
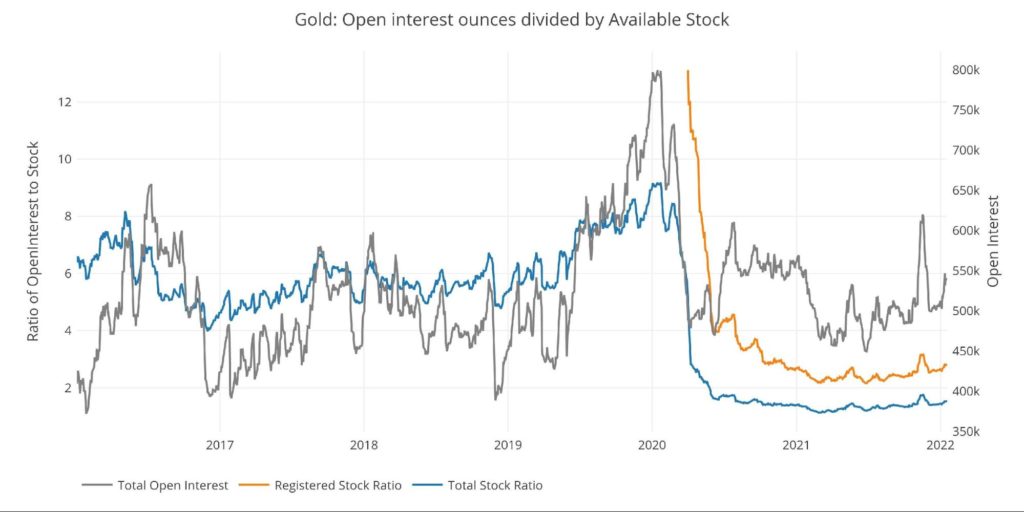
Figure: 9 Open Interest/Stock Ratio
Coverage in silver is weaker than in gold with 9.0 open interest contracts to each available physical supply of Registered (up from 7.4 last month). This was as low as 6.5 in July, after reaching 9.1 in June. This ratio was up to 14 in 2019 before the Covid crash in silver open interest. Silver open interest has not recovered, but this is probably due to higher silver prices (traders may want the same dollar exposure).
If open interest surged back to pre-Covid levels, the ratio would increase dramatically.
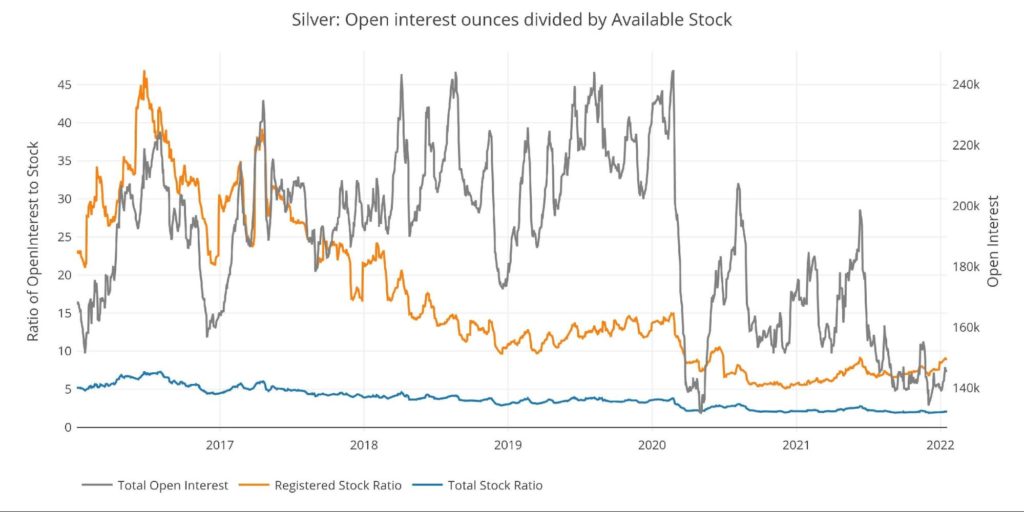
Figure: 10 Open Interest/Stock Ratio
What it Means for Gold and Silver
While the monthly delivery of contracts certainly represents physical demand. Tracking the activity in the Comex vaults shows the actual movement of metal. Open interest can increase much faster than physical metal can show up in Comex vaults.
Aggregate house accounts were crushed in 2021. Bank of America has led the way, engaging in very odd behavior recently with their house account. The delivery reports will be the first indication of a run on the Comex. This could then materialize in the stock report, especially if inventory outflows pick up in the year ahead. If a true “precious metal run” occurred, the Comex would be hard-pressed to meet all physical demand.
Data Source: https://www.cmegroup.com/
Data Updated: Daily around 3 PM Eastern
Last Updated: Jan 18, 2022
Gold and Silver interactive charts and graphs can always be found on the Exploring Finance dashboard: https://exploringfinance.shinyapps.io/goldsilver/

Call 1-888-GOLD-160 and speak with a Precious Metals Specialist today!
Buka akaun dagangan patuh syariah anda di Weltrade.
Source link