Index Slams into 200-Day EMA

Right now, if you try to buy this market, then you are trying to “catch a falling knife.”
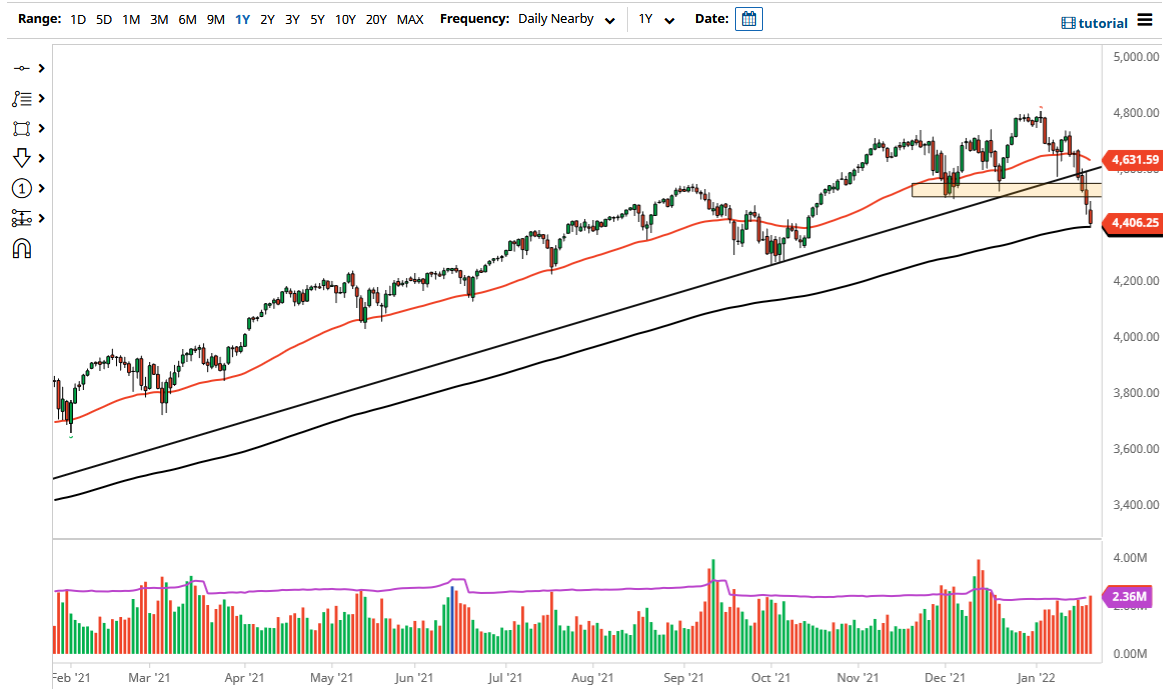
The S&P 500 gapped lower on Friday, turned around to fill the gap, and then turned around again and broke down rather significantly. The market has slammed into the 4400 level and the 200 day EMA. The 200 day EMA is an indicator that a lot of people will pay close attention to, and now that we are threatening it, a lot of people will be paying close attention to the S&P 500. It is possible we could see a major selloff at this point in time.
I suspect that the market is essentially throwing a tantrum to catch the attention of the Federal Reserve. After all, it is the central bank trying to raise interest rates that scares a lot of traders out there, as getting some type of easy return in the bond market instead of messing around with the growth stocks becomes the easier trade. Algorithms will certainly pay close attention to the 200 day EMA, and at this point in time the market needs to find some reason to bounce. If we do bounce from here, then the market could go looking towards the 4500 level, which is a large, round, psychologically significant figure and an area that has offered a bit of support previously.
On the other hand, if we break down below the 200 day EMA, it is very likely that we will go looking towards the 4250 handle, maybe even the 4000 level after that. That could be a massive correction of 20% waiting to happen, at which point I suspect that the Federal Reserve may pay close attention. This is the same thing that we had seen back in 2018, when the market threw a temper tantrum about Federal Reserve Chairman Jerome Powell suggesting that the bond purchases were going to stop. Right now, the Federal Reserve looks as if it is trying to hold the line when it comes to tightening, but sooner or later Wall Street will get its way, because it always does. Right now, if you try to buy this market, then you are trying to “catch a falling knife.” We are closing towards the bottom of the candlestick, so that does suggest that we are more than likely going to see a bit of follow-through.
Source link


