There is a medium-term double bottom at $37,179.
Previous BTC/USD Signal
My previous signal last Wednesday was not triggered, as none of the key levels I had identified were reached that day.
Today’s BTC/USD Signals
Risk 0.50% per trade.
Trades must be entered prior to 5pm Tokyo time Thursday.
Long Trade Ideas
- Go long after a bullish price action reversal on the H1 timeframe following the next touch of $40,567, $37,179, or $35,583.
- Place the stop loss $100 below the local swing low.
- Adjust the stop loss to break even once the trade is $100 in profit by price.
- Take off 50% of the position as profit when the trade is $100 in profit by price and leave the remainder of the position to run.
Short Trade Ideas
- Go short after a bearish price action reversal on the H1 timeframe following the next touch of $41,993, $42,896, or $45,668.
- Place the stop loss $100 above the local swing high.
- Adjust the stop loss to break even once the trade is $100 in profit by price.
- Take off 50% of the position as profit when the trade is $100 in profit by price and leave the remainder of the position to run.
The best method to identify a classic “price action reversal” is for an hourly candle to close, such as a pin bar, a doji, an outside or even just an engulfing candle with a higher close. You can exploit these levels or zones by watching the price action that occurs at the given levels.

BTC/USD Analysis
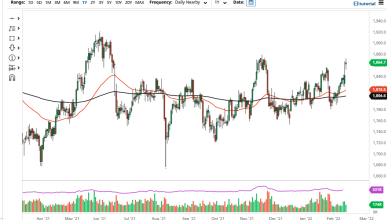
I wrote last Wednesday that the price seemed to be consolidating above the support at $42,896 and below the resistance at $45,668. I thought that as long as the support level at $42,896 continued to hold and the resistance at $45,668 was not reached, the outlook would remain bullish, but a bearish reversal at $45,668 would be a significant bearish signal and would likely provide a great spot to enter a short swing trade.
This was a good call, as although the price remained between those levels over the day, later the price broke below $42,896 and then continued to fall to reach as low as nearly $37k, so my identification of pivotal points was accurate.
We see a more bullish technical picture now, as my support level at $37,179 was hit Monday and held very precisely, forming a medium-term bullish double bottom. The price began to rise from there and over the past day, the rise has accelerated.
Bulls do need to be cautious as the price is now close to $41,993 which looks likely to act as resistance, so we may be at the end of this bullish wave.
I think the best opportunities that might set up today will probably be either a long trade from a retracement to $40,568 or a short trade from a bearish reversal at $42,896.
If the price can continue to rise and get established above $42,896 that will be a bullish sign, suggesting the price will be likely to go on to rise to reach the very important resistance level at $45,668.

Regarding the USD today, there will be a release of JOLTS job openings data at 3pm London time.
Source link