Dip to $130 or breakout above $150 can be interesting long trades.
Today’s Solana Analysis
Risk 0.50%.
Trades may only be taken before 5pm Tokyo time Thursday 13/01/2022.
Long Trade Ideas
- Go long following a bullish price action reversal on the H1 timeframe immediately after the next touch of $138.27, $130.00, or following an hourly close above $150.
- Put the stop loss $3 below the local swing low.
- Move the stop loss to break even once the trade is $10 in profit.
- Remove 50% of the position as profit when the price reaches $10 in profit and leave the remainder of the position to ride.
Short Trade Idea
- Go short following a bearish price action reversal on the H1 timeframe immediately after the next touch of $155.34.
- Put the stop loss $3 above the local swing high.
- Move the stop loss to break even once the trade is $10 in profit.
- Remove 50% of the position as profit when the price reaches $10 in profit and leave the remainder of the position to ride.
The best method to identify a classic “price action reversal” is for an hourly candle to close, such as a pin bar, a doji, an outside or even just an engulfing candle with a higher close. You can exploit these levels or zones by watching the price action that occurs at the given levels.
SOL/USD Analysis
It is an exciting time for cryptocurrencies in general right now, and for Solana in particular.
We see the beginning of a potentially bullish environment for this asset class after an extended period of serious decline. Bitcoin seems to be finding support at $40k, and Ethereum at $3k, at the same time. This is a bullish sign.
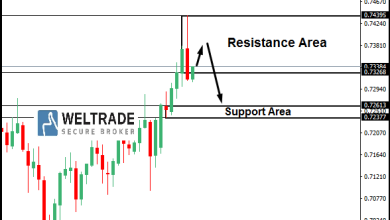
Turning to Solana, the price reached its 50% retracement from its record high made last year just a few days ago at $130. This may well be a long-term low.
While the price chart below shows a pattern of lower lows and lower highs, the rate of decrease has shallowed greatly, and we start to see what looks like the completion of a bullish over and under / Quasimodo pattern as the low at $138.27 holds. This support level is likely to be extremely important over the short term. If it holds, this will be a bullish sign, and if we get a bullish move soon that finishes with the price established above $150.00 that will be an even stronger bullish sign.
If the support level at $138.27 does not hold, look for the price to continue falling to $130.00 and if there is another firm bullish bounce there, that could be an excellent long-term buying opportunity.
If the price breaks above $150.00 but then fails strongly at $155.34 that could be a good short trade opportunity. Therefore, long-term buyers might prefer to wait for the price to break above $155.34 and not just $150.00 before entering any long trade.

Concerning the USD, there will be a release of US CPI (inflation) data at 1:30pm London time. There is nothing of high importance scheduled today concerning Solana.
Source link