The pair will likely remain in this range today.
Bearish View
-
Sell the BTC/USD and set a take-profit at 45,700.
-
Add a stop-loss at 48,000.
-
Timeline: 1-2 days.
Bullish View
-
Set a buy-stop at 47,000 and a take-profit at 49,000.
-
Add a stop-loss at 45,700.
The BTC/USD pair had a sluggish start of the year as the demand for Bitcoin remained low. The pair is trading at 46,865, which is about 31% below the highest level in 2021. It is about $14,000 above where it was at the same time in 2021.

Focus Shifts to the Fed
The BTC/USD pair declined on Monday as worries of the surging Covid-19 cases in key countries like the United States remained. While most people in the United States have been vaccinated, the number of daily infections has surged to an all-time high.
According to the New York Times, the 14-day average has risen to more than 400k. Worse, these numbers show that most of these cases have been breakthroughs. On the positive side, the number of deaths has been falling recently. It has fallen by 1.4% in the past 14 days. Therefore, there is a possibility that the BTC/USD is falling as investors worry about the trends of these cases.
Another concern is that the Federal Reserve and other central banks will be less supportive of the economy this year. In the United States, the Fed has hinted that it will start to hike interest rates this year. In total, the bank is expected to implement three rate hikes by December. Also, the Fed is expected to halt its asset purchases in March as it seeks to slow the rising inflation.
The focus will be on institutional adoption as the US is expected to come up with regulations to govern the industry. In 2021, the Securities and Exchange Commission (SEC) and other regulators announced that they were coming up with regulations. As the industry gains more regulatory clarity, analysts expect that institutional investors will jump in.
BTC/USD Forecast
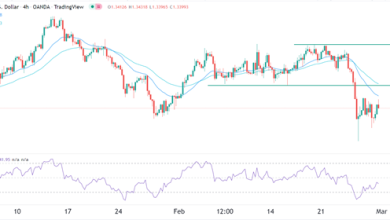
The four-hour chart shows that the BTC/USD pair has been under pressure lately. It has fallen by about 10% from its highest level on December 27th. It also moved slightly below the 25-day and 50-day moving averages while the Moving Average Convergence Divergence (MACD) has formed a bullish divergence pattern.
The pair is also slightly above the key support at 45,700, where it has struggled to move below several times in December. Therefore, the pair will likely remain in this range today. A move below the key support at 45,700 will signal that there are more sellers in the market.

Source link