British Pound, GBP/USD, US Dollar, Fed, FOMC, Treasuries – Talking Points
- The British Pound held firm against a hawkish Fed lifting USD
- Higher yields hit tech stocks in the FOMC meeting minutes aftermath
- Sterling could be gaining momentum. Will GBP/USD break higher?
The British Pound has shown resilience in recent sessions against a US Dollar being fuelled by a Federal Reserve delivering more hawkish news, fanning Treasury yields higher.
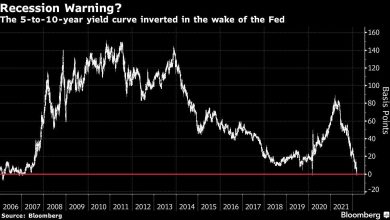
The December Federal Open Market Committee (FOMC) meeting minutes were released in the US session and showed that members are expecting to tighten policy at a faster pace than previously anticipated.
Markets now expect the first hike to be in March and the end of the asset purchase program to be much sooner and a reduction in the overall balance sheet was discussed.
The benchmark 10-year Treasury yield is trading close to 1.72%, an 8-month high. The 2 and 5-year bonds are trading at post-pandemic highs near 0.84% and 1.44% respectively.
All this has seen demand for US Dollars surge, most notably at the expense of AUD, CAD, NOK and NZD in the Asian session. The GBP, CHF, EUR and JPY have fared better today.
The sterling has been somewhat supported by Gilts seeing higher yields. The 10-year bond opened the year yielding 0.97% before trading near 1.10% overnight.
Bitcoin was hit hard in the US session, down over 5%, to touch a low near USD 45,500.
The higher yield environment has continued to see the tech sector come under pressure with the Nasdaq falling over 3% in the cash session.
According to a report from Goldman Sachs, hedge fund exposure to tech companies relative to S&P 500 names are now at their lowest level ever.
Korea’s tech based Kosdaq index is seeing similar losses but Hong Kong’s Hang Seng Tech index is less impacted after falling 4.5% yesterday.
The lift in yields has seen real rates rise and this has undermined gold and silver. Crude oil remains steady with WTI trading just under USD 77 a barrel after hitting a 6-week high of USD 78.58 a barrel.
After the UK PMI print today, the US will see economic data on trade, jobs, factory orders and durable goods orders, as well as the ISM services index.
GBP/USD Technical Analysis
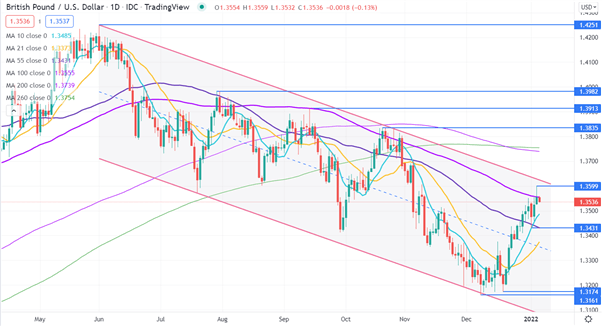
The peak in June last year of 1.4251 was the highest for GBP/USD since early 2018.
Since then, it has been caught in a descending trend channel. It is not far from breaking the upper side of the channel. It currently dissects at 1.3625 and might offer resistance.
Resistance could also be at the previous highs of 1.3599, 1.3835, 1.3913, 1,3982 and 1.4251.
GBP/USD has moved above its’ short and medium term simple moving averages (SMA) but it is struggling to clear the 100-day SMA for the moment. A decisive break above it may see further bullish momentum unfold.
On the downside, support might be at the previous lows of 1.3431, 1.3174 and 1.3161.
— Written by Daniel McCarthy, Strategist for DailyFX.com
To contact Daniel, use the comments section below or @DanMcCathyFX on Twitter
Buka akaun dagangan patuh syariah anda di Weltrade.
Source link