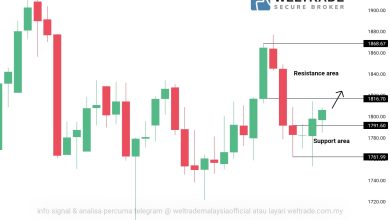
A more bearish breakout will be confirmed if the pair manages to move below last week’s low of 39,800.
Bearish View
- Set a sell-stop at 39,800 and a take-profit at 37,000.
- Add a stop-loss at 42,000.
- Timeline: 1-2 days.
Bullish View
- Set a buy-stop at 43,000 and a take-profit at 45,000.
- Add a stop-loss at 40,000.
The BTC/USD remained under pressure as a decline in key global assets continued. The pair has dropped in the past two straight days and is trading at 41,625, which is about 40% below its all-time high. It is hovering near its lowest level since October.

US Bond Yields
Bitcoin and other cryptocurrencies declined sharply in the overnight session. This decline coincided with the overall sell-off of other assets like stocks. The Dow Jones declined by over 500 points while the S&P 500 and Nasdaq 100 indices fell by over 1%.
There are two main reasons why stocks declined. First, the ongoing earnings season has turned out to be weaker than expected. For example, closely watched Wall Street banks like Citigroup, JP Morgan, and Goldman Sachs published weak results.
Second, stocks and Bitcoin prices retreated as investors watched the American bond market. The bond sell-off that started a few weeks ago continued this week, with the 10 and 30-year yields jumping to the highest level in two years.
Risky assets like Bitcoin tends to underperform in a period of rising bond yields since it is usually a signal that the Fed will hike interest rates. The Fed has already hinted that it will implement about 3 rate hikes this year.
The BTC/USD pair also declined as a buy the rumour, sell the fact situation emerged. During the weekend, prices rose as investors waited for the North America Bitcoin Conference (NABC). The conference started on Monday in Miami. While such events leads to higher prices, this one did not because the speakers did not include key policymakers.
Another reason why the BTC/USD pair has retreated is that investors are generally fearful about the market. The crypto fear and greed index has slumped to the lowest level in months.
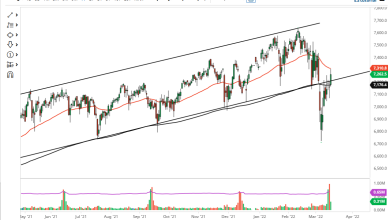
BTC/USD Forecast
The daily chart shows that the BTC/USD pair has been in a strong bearish trend in the past few days. The sell-off started in November when the pair jumped to an all-time high of almost 70,000. It has moved below the 25-day and 50-day moving averages while the the Relative Strength Index (RSI) has been in a bearish trend.
Therefore, a more bearish breakout will be confirmed if the pair manages to move below last week’s low of 39,800. A drop below that level will signal that there are still more sellers in the market. The next key level to watch will be at 35,000.

Source link