
Median Fed Projections

The St. Louis Fed Fred repository recently added a data series on Fed projections. My graph reflects the Median Projections FEDTARMD Series.
Unfortunately the data is annual and it only starts with 2021, looking ahead.
Past projections would be more than a bit humorous if Fred had the data.
The observation dates all say January, but they are really end-of-year projections. Since the data is annual, I used monthly averages which is a bit off as the Fed does not meet once a month.
I added the Factor column to the data download. It is the monthly average rate hike that gets to the Fed’s yearend projections.
Current Yield Chart Notes
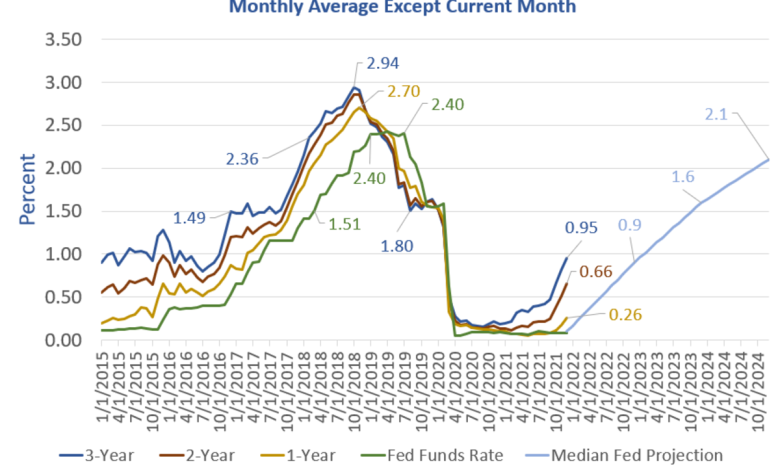
- In June of 2017 the 3-year yield was 1.49%. The Fed Funds Rate (FFR) did not catch up until March of 2018 at 1.51%, about 9 months later.
- In February of 2018 the 3-year yield was 2.36%. The FFR did not catch up until January of 2019 at 2.40%, about 11 months later.
- In October of 2018 the 3-year yield was 2.94%. The FFR never got close.
- In July of 2019, the FFR was still at 2.40% but the 3-year yield collapsed 1.80%
Yields then crashed across the board. And this predated Covid-19 which did not hit until February-March of 2020.
Predictive Value
The only predictive value in any of this was the inversion.
Analysis of Fed Dot Plots shows how totally clueless the Fed has been.
December 2017 Fed Projections

December 2018 Fed Projections

December 2021 Fed Projections

The Fed Expects 6 Rate Hikes By End of 2023 – I Don’t and You Shouldn’t Either
I have more dot plots and discussion in The Fed Expects 6 Rate Hikes By End of 2023 – I Don’t and You Shouldn’t Either
What’s Happening?
Take another look at the lead chart and the 2.94% monthly average yield on the 3-year note in October of 2018.
There was no predictive value in that rate. The yield only got that high because market participants were busy front-running Fed statements.
Amusingly, the Fed considers “forward guidance” a tool. It’s a tool alright, for front-running interest rate bets until they blow up.
The curious thing about all of this is the Fed actually believes and takes cues from the market while giving cues to the market with its own projections!
S&P Spotlight October 2007

If you think the stock market has predictive value, then what was it saying other than “All’s Well” in October and November of 2007?
And what about that nice sucker rebound in April-May of 2008?
Meanwhile, then Fed Chair Ben Bernanke was yapping to Congress there was no housing bubble to burst.
Dot Plot and Futures Reflections
Fed Uncertainty Principle
Actually, it’s important to understand that the market forecast reflects the Fed’s Dot Plot forecast!
The “beauty” of Fed forward guidance is that it eventually pushes the forward expectations curve in the direction the Fed wants it to go, whether the Fed actually gets around to hiking or not.
Then the Fed believes it’s own manipulative guidance provides some sort of signal that it’s on the right track right before it all blows up.
Yes, it’s an embarrassment for sure.
I discussed this phenomenon at length years ago in The Fed Uncertainty Principle.
The fed, by its very existence, has completely distorted the market via self-reinforcing observer/participant feedback loops. Thus, it is fatally flawed logic to suggest the Fed is simply following the market, therefore the market is to blame for the Fed’s actions. There would not be a Fed in a free market, and by implication, there would not be observer/participant feedback loops either.
Corollary Number One:
The Fed has no idea where interest rates should be. Only a free market does. The Fed will be disingenuous about what it knows (nothing of use) and doesn’t know (much more than it wants to admit), particularly in times of economic stress.
I am a bit proud of the timing of that post, April 3, 2008 right before the housing implosion that Bernanke denied was coming.
There are three additional corollaries and much more discussion that I liken to the Heisenberg Uncertainty Principle.
Please give it a look.
Tail Risk
Please consider these Tweets.
Understanding the Information
There certainly is no information in Fed projections.
How can there be?
The Fed has never spotted a recession in real time let alone predicted one in advance.
Nor is there any information in any particular yield.
But there is information when yield curves invert, even when they flatten. The current flattening suggests the Fed will not get to where it believes it will.
The long bond vs the 3-month is where most of the flattening has been and I have been watching that closely.
It’s a signal, but not a timing mechanism.
Duration of Fed’s Balance Sheet US Treasuries

Note that the Fed’s balance sheet is so robust that it lends itself well to micromanagement of rates even if and when the Fed finishes.
I discussed that in The Fed’s Balance Sheet Shows Intent to Support Housing Forever
I suspect the Fed will make a statement about maintaining its balance sheet for “a while” if and when they actually finish tapering,
Then the Fed will have lots of room to do things like buy more 3-year notes and sell 5-year notes (or vice versa, whatever the Fed seeks to accomplish) right from its balance sheet without having to resort to new operations.
The Fed might be able to pull off an Operation Twist move without even announcing it. In this kind of setup, the yield curve may go flat without strongly inverting.
Given the increased ability of the Fed to micromanage the yield curve without starting new programs, don’t think we will necessarily have huge inversions across the curve as has happened in previous recessions.
In this regard, the flattening may already be ominous.
Current Yield Notes
As of December 22, 2021 the 3-year yield was 0.95%.
The Fed Funds Rate supposedly will match in December of 2022, a year away.
Hmm. That’s another 3-year to FFR one-year look ahead expectation that just happens to match the current dot plot of Fed thinking.
Place your bets!
Addendum
I did revise the title of this post and added paragraphs on “Understanding the Information” because there is information in flattening and inversions, just not long-term projections.
Thanks for Tuning In!
Like these reports? If so, please Subscribe to MishTalk Email Alerts.
Subscribers get an email alert of each post as they happen.
Read the ones you like and you can unsubscribe at any time.
If you have subscribed and do not get email alerts, please check your spam folder.
Mish
Source link