While the overall trend is bearish, there is a likelihood that the pair will rebound in the coming days after the options expiration.
Bullish View
-
Buy the BTC/USD pair and add a take-profit at 50,000.
-
Add a stop-loss at 46,000.
-
Timeline: 2 days.
Bearish View
-
Sell the BTC/USD and add a take-profit at 46,000.
-
Add a stop-loss at 48,000.
The BTC/USD pair remained under pressure on Thursday morning as demand for Bitcoin remained sluggish. The pair is trading at 47,615, which is about 10% below its highest level this week.

Options Expiry
It is unclear why Bitcoin has struggled in the past few days considering that American equities have been relatively strong in the past few days. The S&P 500 is trading at a record high while the Dow Jones is a few points below its all-time high.
A possible reason is that investors are selling Bitcoin ahead of the options expiry that will happen on Friday. A total of 129,800 options contracts worth about $6 billion will expire. In most cases, Bitcoin tends to see some weakness ahead of expiration.
This trend happens because of spot traders who try to push the spot price closer to the strike price. At this point, the highest number of open options usually expire worthlessly, which leads to max pain for options buyers. This point will be $48,000, which is slightly above the current level.
Another possible reason for the current price action of the BTC/USD pair is that the low volume in the financial market is leading to substantial volatility. We have already seen some volatility in other markets, including the bond market.
In addition, the BTC/USD pair is likely falling because of the Federal Reserve. The Fed has hinted that it will start to unwind its easy-money policies in the coming months. It will end its quantitative easing program in March and then implement three rate hikes in 2022. In most cases, risky assets like Bitcoin tend to underperform when the Fed has embraced a hawkish tone.
BTC/USD Technical Analysis
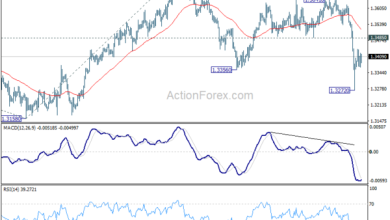
The four-hour chart shows that the BTC/USD pair has been under pressure lately. The pair is trading at 47,615, which is lower than the chin of the double-top pattern at 49,418. It has also moved slightly below the 25-day and 50-day moving averages and is a few points above the key support at 46,000. It is also a few points below the 23.6% Fibonacci retracement level.
Therefore, while the overall trend is bearish, there is a likelihood that the pair will rebound in the coming days after the options expiration. If this happens, the next key resistance to watch will be at 50,000.

Source link