There is a likelihood that it will tilt lower as bears target the ascending trendline at about 1.3515.
Bearish View
- Sell the GBP/USD and set a take-profit at 1.3515.
- Add a stop-loss at 1.3650.
- Timeline: 1-2 days.
Bullish View
- Set a buy-stop at 1.3600 and a take-profit at 1.3700.
- Add a stop-loss at 1.3500.
The GBP/USD price was little changed on Monday morning as investors reflected on last week’s data dump from the UK and the growing tensions in Europe. The pair is trading at 1.3587, which is about 45 basis points below the highest point last week.
UK Economy Doing Well
Data published by the UK last week showed that the country’s economy is doing well. On Tuesday, the Office of National Statistics (ONS) showed that the country’s labor market is performing well. The unemployment rate declined to about 4.1% while wages kept rising.
Further data published on Wednesday revealed that the country’s inflation held steady in January. The headline consumer price index (CPI) rose to a 30-year high of 5.5% as food and energy prices jumped. Excluding the volatile food and energy prices, core CPI rose to about 4%.
Meanwhile, on Friday, data showed that the country’s retail sales rose in January after falling in the previous month. The increase was likely because of shopping was a bit limited in December as worries of the Omicron variant spread. In total, the headline retail sales rose by 1.9%, the highest figure since April last year.
And on Monday, Markit will publish the flash manufacturing, services, and composite PMI data from the UK. Again, analysts expect the data to show that the two PMIs did well in February as the UK abandoned most of its Covid-19 restrictions.
Therefore, these numbers are putting more pressure on the Bank of England (BOE) to tighten at a faster pace. The bank has already made two rate hikes and analysts expect that it will implement a few more hikes later this year. Some even expect about 4 hikes this year.
The volume of the GBP/USD will be a bit low since American investors will be away from the market because of the President’s Day holiday.
GBP/USD Forecast
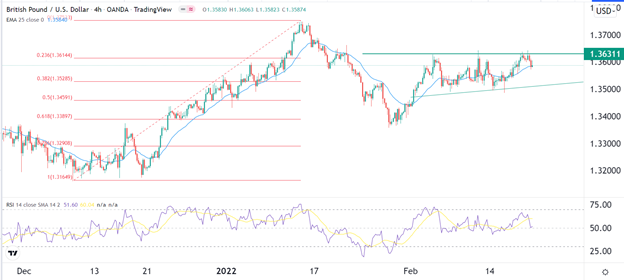
The four-hour chart shows that the GBP/USD pair formed a strong resistance at about 1.3610. It has struggled moving above this level throughout the month. The pair has also moved slightly below the 25-day moving average while the Relative Strength Index (RSI) has tilted lower. It has also moved slightly below the 23.6% Fibonacci Retracement level.
Therefore, while the pair has formed an ascending triangle pattern, there is a likelihood that it will tilt lower as bears target the ascending trendline at about 1.3515.

Source link