The Most Splendid Housing Bubbles in America, Dec. Update: But Prices Stalled in San Francisco, Boston, Washington
The raging mania slows. But it’s still a raging mania.
By Wolf Richter for WOLF STREET.
House prices, instead of spiking by over 2% from one month to the next, and by over 20% year-over-year, spiked by “only” 0.8% for the month, the least explosive spike since January, and spiked by “only” 19.1% year-over-year, the least explosive spike since June, according to the S&P CoreLogic Case-Shiller National Home Price Index today. House prices rose in 18 of the 20 metro areas in the index – by just a tad in some; by a leap in others.
But prices stalled in the San Francisco Bay Area for the first time since June 2020, and in Boston for the first time since February 2020, something we haven’t seen in a while.
“The slowing of home prices is most notable in colder and more expensive areas, as well as middle-tier priced homes where homebuyers may have less wiggle room in their budgets,” said CoreLogic Deputy Chief Economist Selma Hepp today. “Low-tier priced homes are still in higher demand as entry-level buyers and investors continue to compete for the very limited supply.”
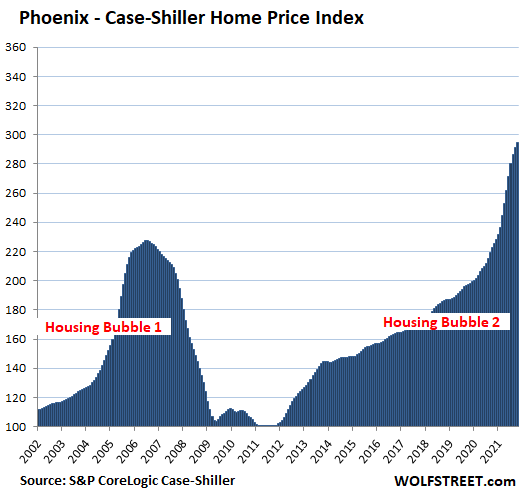
House prices have performed truly crazy feats, with prices in Phoenix being up 32% year-over-year, 28% in Tampa, 26% in Miami, 25% in Las Vegas, and 24% in San Diego. But even in those crazy markets, price increases have been slowing.

The charts below show the metropolitan areas with the most stunning price spikes, as tracked by the Case-Shiller Home Price Indices today. In terms of the time frame, note the lag: Today’s “October” data are a three-month moving average of closed sales that were entered into public records in August, September, and October.
It’s not a miracle of houses getting bigger; it’s that the dollar is losing purchasing power. The Case-Shiller Index, by using the “sales pairs method,” compares the sales price of a house when it sells in the current period to the price of the same house when it sold previously. It includes adjustments for home improvements and the passage of time since these sales pairs can be decades apart. By tracking the price of the same house over time, it is a measure of how many dollars it takes to buy the same house, and it’s therefore a measure of the loss of the purchasing power of the dollar with regards to houses, and therefore a measure of house price inflation.
Los Angeles metro: Prices of single-family houses jumped 1.3% in October from September, and by 18.5% year-over-year.
This 270% price increase since January 2000 enshrines Los Angeles as the most splendid housing bubble on this list – the metro with the most house price inflation since January 2000. The charts below are on the same scale to show the relative house price inflation in each market.
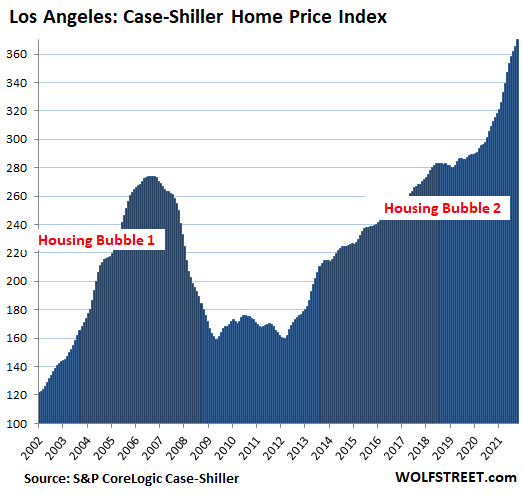
The Case-Shiller Indices were set at 100 for January 2000. The index value of 370 for Los Angeles means that house prices have soared by 270% since January 2000, despite the Housing Bust in the middle. By comparison, since January 2000, the Consumer Price Index (CPI) rose by 65%.
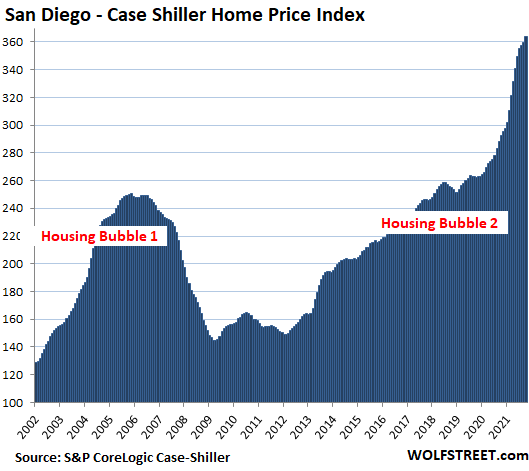
San Diego metro: Prices of single-family houses rose 1.1% for the month, still ridiculous but down from the peak-heat spike in March of 3.4%. This whittled down the year-over-year spike to 24.2%, from peak-heat in July of 27.8%. Since 2000, the index has ballooned by 264%:
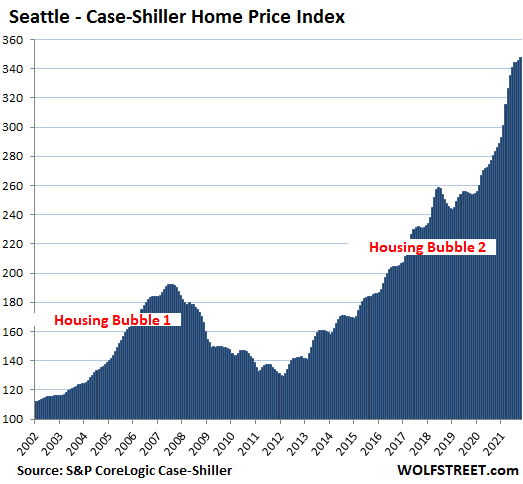
Seattle metro: House prices rose by 0.6% for the month, which whittled down the year-over-year spike to 22.7%, from peak-heat in July of 25.5%. Since January 2000, the index has soared 248%:
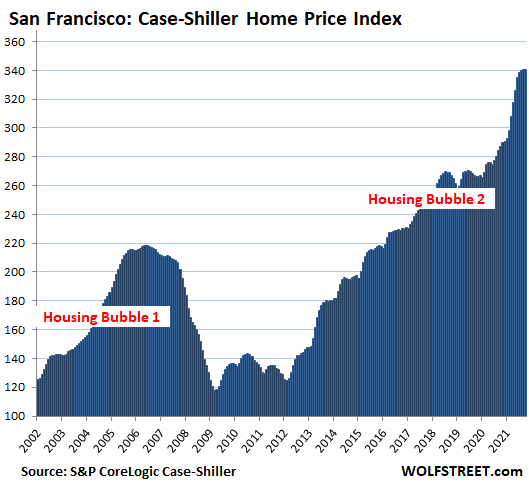
San Francisco Bay Area (counties of San Francisco, San Mateo, Alameda, Contra Costa, and Marin): House prices were flat in October with September, after having inched up just 0.1% in the prior month. October was the first month since June 2020 that prices didn’t move up. This whittled down the year-over-year spike to 18.5% from peak-heat of 21.9% in June and July.
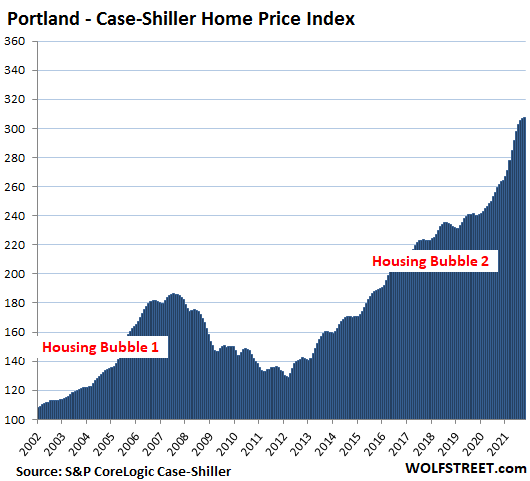
Portland metro: The Case-Shiller index rose by 0.3% for the month, the slowest month-to-month increase since December 2019, which whittled the year-over-year spike down to 17.7% from peak-heat in July of 19.5%:
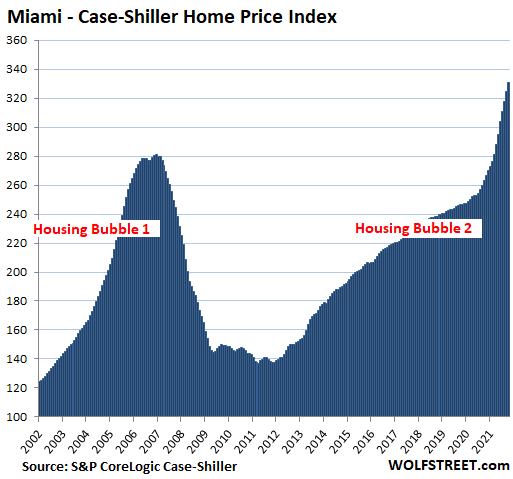
Miami metro: House prices spiked by 1.8% in October from September, just a tad less relentless than in prior months, with peak-heat of 3.1% in June. Year-over-year, prices spiked by 25.7%, the fastest since March 2006 during the peak of Housing Bubble 1, just before the onset of the Housing Bust:
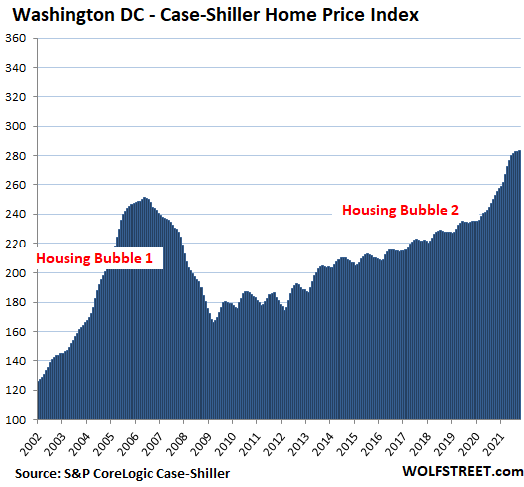
Washington D.C. metro: House prices +0.2% for the month, after stalling in the prior month, which is something that hasn’t happened since January 2020. This whittled down the year-over-year gain to 12.0%, down from peak-heat in June of 15.4%, and the lowest jump since December 2020:
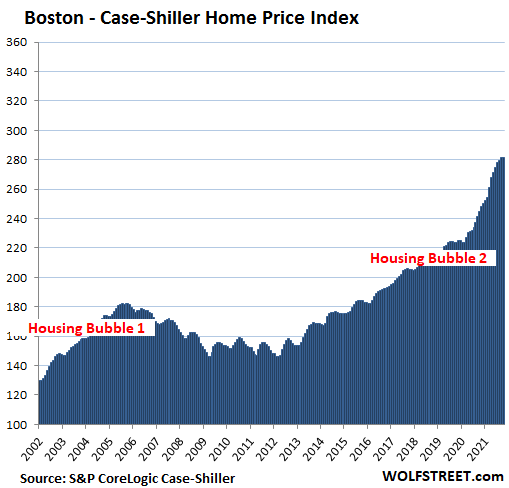
Boston metro: House prices were nearly flat for the month, after peak-heat in March with a 2.6% month-over-month gain. This was the first stall since the drop in February 2020, and it whittled down the year-over-year gain to 15.1%:
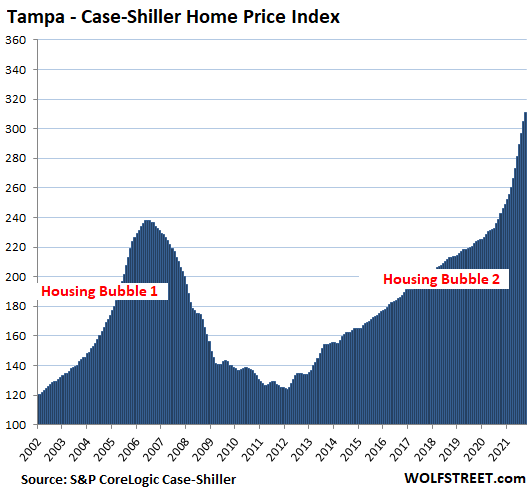
Tampa metro: +1.9% for the month, the slowest spike since February. This pushed the year-over-year spike to a new crazy record of 28.1%, out-spiking even the craziness during the peak of Housing Bubble 1:
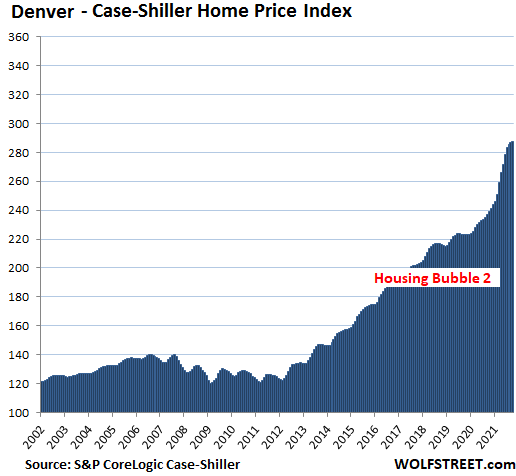
Denver metro: +0.2% for the month, the slowest since the drop in December 2019. This whittled the year-over-year spike down to 20.3%:
Phoenix metro: +1.1% for the month, the slowest month-to-month spike since July 2020. +32.1% year-over-year, down from over 33% in the prior two months, the red-hottest annual spikes in this line-up of the most splendid housing bubbles, out-spiking the spikes at the peak of Housing Bubble 1, but this time it’s different, no?
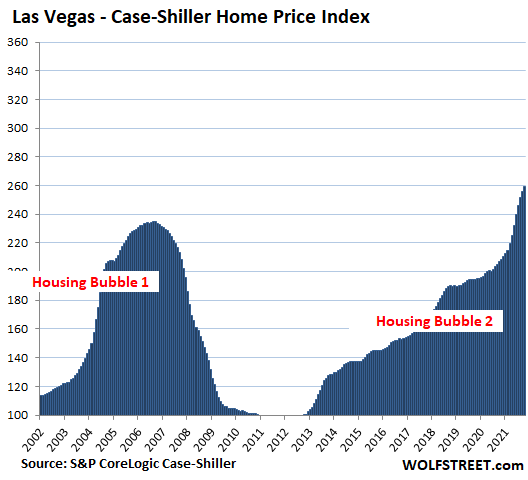
Las Vegas metro: +1.5% for the month, down from peak-heat in June of 3.4%. +25.5% year-over-year:
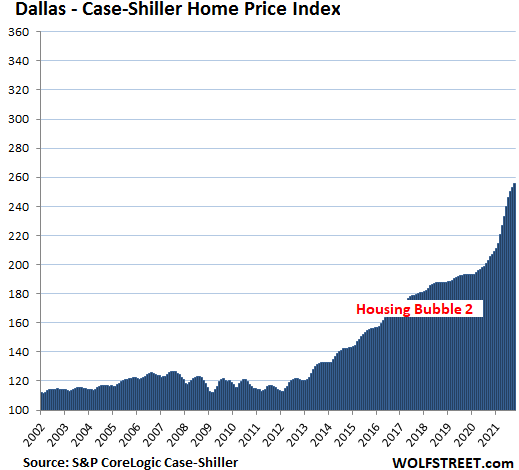
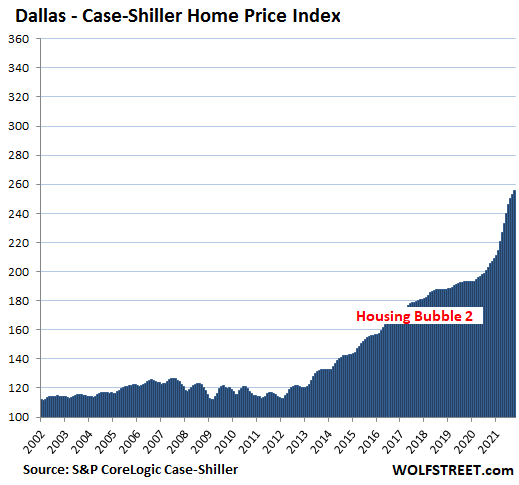
Dallas metro: +1.1% for the month, +24.6% year-over-year. The index is up 156% since 2000.
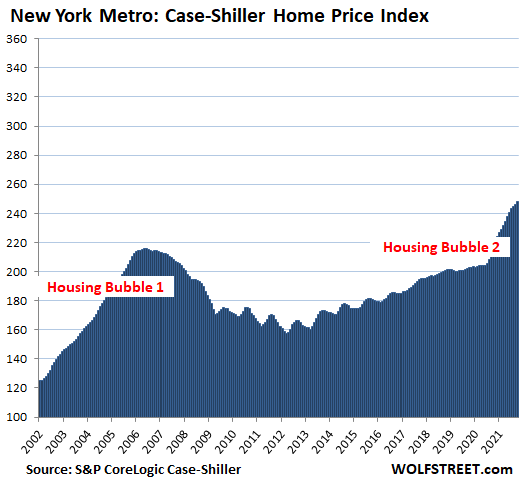
New York metro (New York City plus numerous counties in the states of New York, New Jersey, and Connecticut): House prices jumped 0.7% for the month. The last three months saw the least rapid gains since August 2020. This whittled down the year-over-year gain to 14.6%, the slowest since March. This is a huge diverse metro, that includes some of the most expensive real estate in the US, but also other areas in New Jersey and Connecticut, where house price inflation was a lot lower.
The remaining metros in the 20-metro Case-Shiller Index have house price inflation since 2000 of substantially less than 150% and thereby don’t yet qualify for this list of the most splendid housing bubbles.
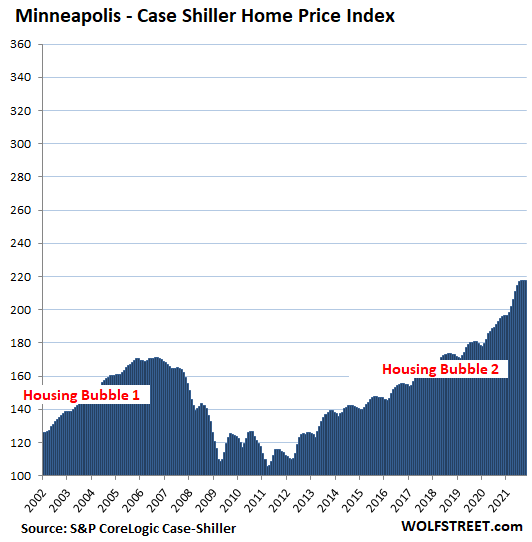
But wait… Minneapolis: This is where, back in April, house prices had jumped 2.3% from March. And now Minneapolis is the first metro where house prices dropped for the month, and stalled for three months in a row, followed by San Francisco, Boston, and Washington D.C. And even if it’s just a seasonal thingy, it would be the first seasonal thingy in two years:
Enjoy reading WOLF STREET and want to support it? Using ad blockers – I totally get why – but want to support the site? You can donate. I appreciate it immensely. Click on the beer and iced-tea mug to find out how:

Would you like to be notified via email when WOLF STREET publishes a new article? Sign up here.
![]()
Classic Metal Roofing Systems, our sponsor, manufactures beautiful metal shingles:
- A variety of resin-based finishes & colors
- Deep grooves for a high-end natural look
- Maintenance free – will not rust, crack, or rot
- Resists streaking and staining
To reach the Classic Metal Roofing folks, click here or call 1-800-543-8938
Source link