Spot natural gas prices (CFDS ON NATURAL GAS) continued to rise during recent trading at the intraday levels, to achieve new daily gains until the moment of writing this report, by 3.24%. It settled at the price of $4.601 per million British thermal units, after rising during yesterday’s trading and for the third session by 4.84%.

Prices continued their sharply upward trend as the possibility of cold weather increased in early March. This is despite the easing of geopolitical tensions over the crisis of fears of the Russian invasion of Ukraine, as Nymex gas futures for March rose by 11.1 cents to settle at $4.306 per million. The April contract advanced 8.1 cents to reach $4,241.
Most of NGI’s Spot Gas National Avg prices rose ahead of another winter storm targeting the Lower 48 region of the US this weekend.
Weather-On-Demand Services said US and European models made another step in the cooler direction overnight given some changes in climate patterns.
NatGasWeather indicated that the Global Midday Forecasting System (GFS) was still warmer than the European model, but was skewed closer by showing sub-freezing temperatures moving more strongly to the northern US from February. He added approximately 25 degrees of temperature (Fahrenheit) in a 24-hour period. The company indicated that continued cooling will ensure that the current supply shortfall is near 250 billion cubic feet at the beginning of March. Moreover, there is the potential for the supply shortage to increase further if sufficient cold air can be pushed to the lower level in early March.
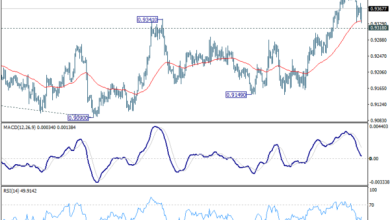
Technically, natural gas continues to rise with the start of positive signals in the relative strength indicators. This is following the formation of what is known as the positive divergence in it, after it reached areas that are highly saturated with exaggerated selling operations compared to the price movement. The price also benefits from the continued positive pressure of its trading above its simple moving average. For the previous 50 days, in light of the dominance of the main bullish trend over the medium term and its trading along a slope line, as shown in the attached chart for a (daily) period.
Therefore, we expect the rise of natural gas during its upcoming trading, as long as the support 4.214 remains, to target the first resistance levels at 4.954.

Source link