We expect more decline for natural gas during its upcoming trading, to target the support level 3.810.
Spot natural gas prices (CFDS ON NATURAL GAS) continued to decline during the recent trading at the intraday levels. The commodity recorded new daily losses as of writing this report, by -0.97%, to settle at $4.096 per million British thermal units. This is after declining during trading yesterday and today with a rate of -4.35%.
Nymex March gas futures settled Wednesday at $4,009, down about 23.9 cents from Tuesday’s close. The April contract fell by 23.8 cents to settle at $3,980.
Natural gas futures took a big step in the middle of the week, as weather models were better aligned in showing more warmth in the outlook for the rest of the month after a short drop below $4,000/MMBtu.
Spot gas prices persisted. NGI’s Spot Gas National Avg declined amid a steady rise in temperatures in most parts of the United States, dropping about 46.0 cents to settle at $4.155.
“Natural gas markets are clearly indicating that the upcoming pattern is not cold enough to prevent a massive amount of selling,” NatGasWeather said.
In the meantime, traders may have to deal with surprises in the US inventory reports. Last week, the Energy Information Administration (EIA) announced its largest winter drawdown to date of 268 billion cubic feet for the week ending Jan. 28.
Ahead of Thursday’s EIA report, Reuters polled 16 analysts with estimates ranging between 206 billion cubic feet and 232 billion cubic feet, with an average estimate of 223 billion cubic feet. Expectations in a Bloomberg survey were as light as 202 billion cubic feet, with an average of 223 billion cubic feet, which covers the week ending February 4th.
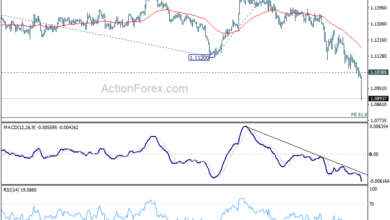
Technically, the price continues to decline amid the influx of negative signals on the relative strength indicators, despite reaching oversold areas, to break through the important support level of 4.214 to settle below it. It crossed in turn the support of its simple moving average for the previous 50 days, to double the pressure on upcoming trades.
Now, the price is left with nothing but its trading along a major bullish slope line over the medium term, as shown in the attached chart for a (daily) period, to be its last positive opportunity that might help it recover.
Our expectations after breaking the 4.214 support level have turned negative in the short term. We expect more decline for natural gas during its upcoming trading, to target the support level 3.810.

Source link