The CPI rose in May by 0.12%. Energy accounted for -0.25% of the move. This means without the move in Energy, the CPI would have risen by 0.37% which annualizes to a rate of 4.5%. This shows that inflation is still quite problematic.
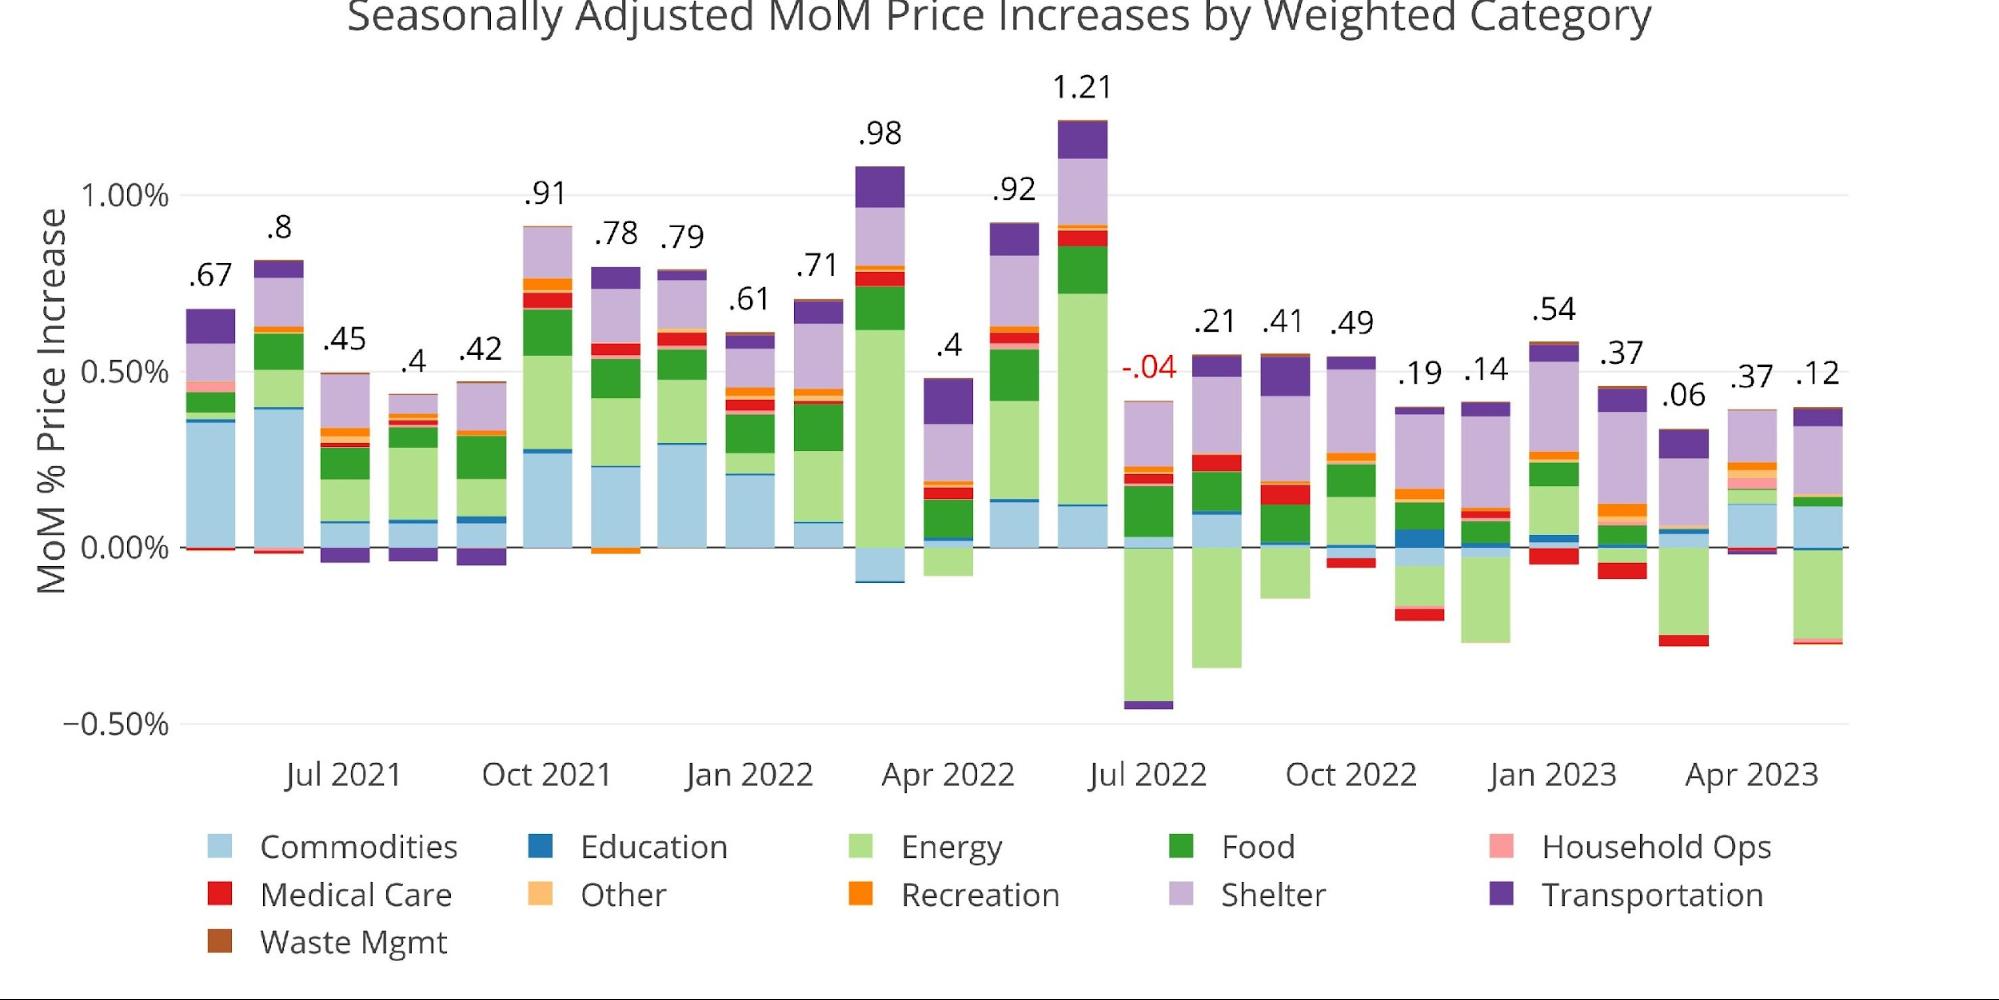
Figure: 1 Month Over Month Inflation
The Biden administration is doing everything it can to help the Fed in its inflation fight by once again tapping the Strategic Petroleum Reserve (SPR) to try and bring down Energy prices. This is a completely irresponsible use of valuable resources. The charts above and below confirm that it definitely helps because, during the pause in the SPR drawdown, the Energy prices were up or close to flat (Jan, Feb, and Apr).
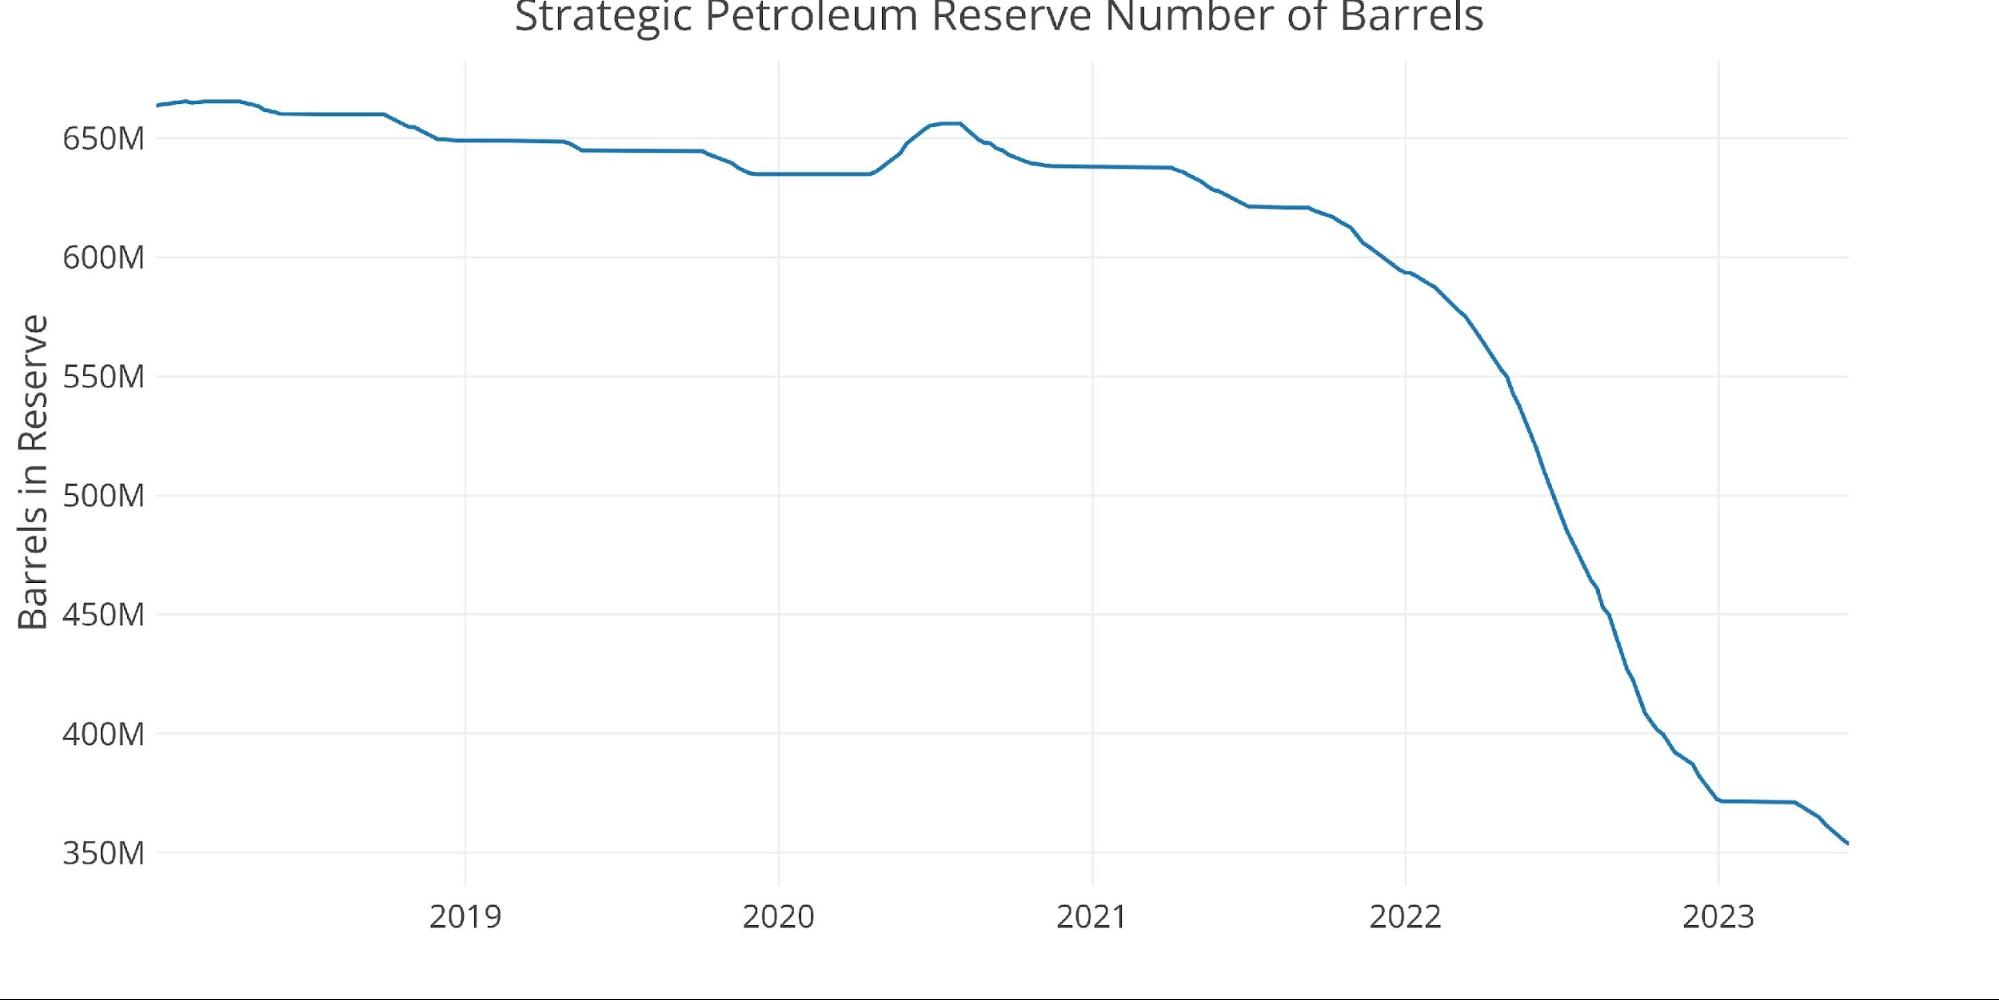
Figure: 2 SPR Inventory
The YoY CPI rise saw a big decline from 4.9% to 4%. This was forecasted last month in an analysis that showed the CPI was two months away from bottoming. This is due to the big months coming off the board. Last May, the CPI rose by .92%. As this was replaced by .12% this month, it naturally brought down the YoY number. Next month could see an even bigger decline as 1.21% comes off the 12-month calendar from June 2022.
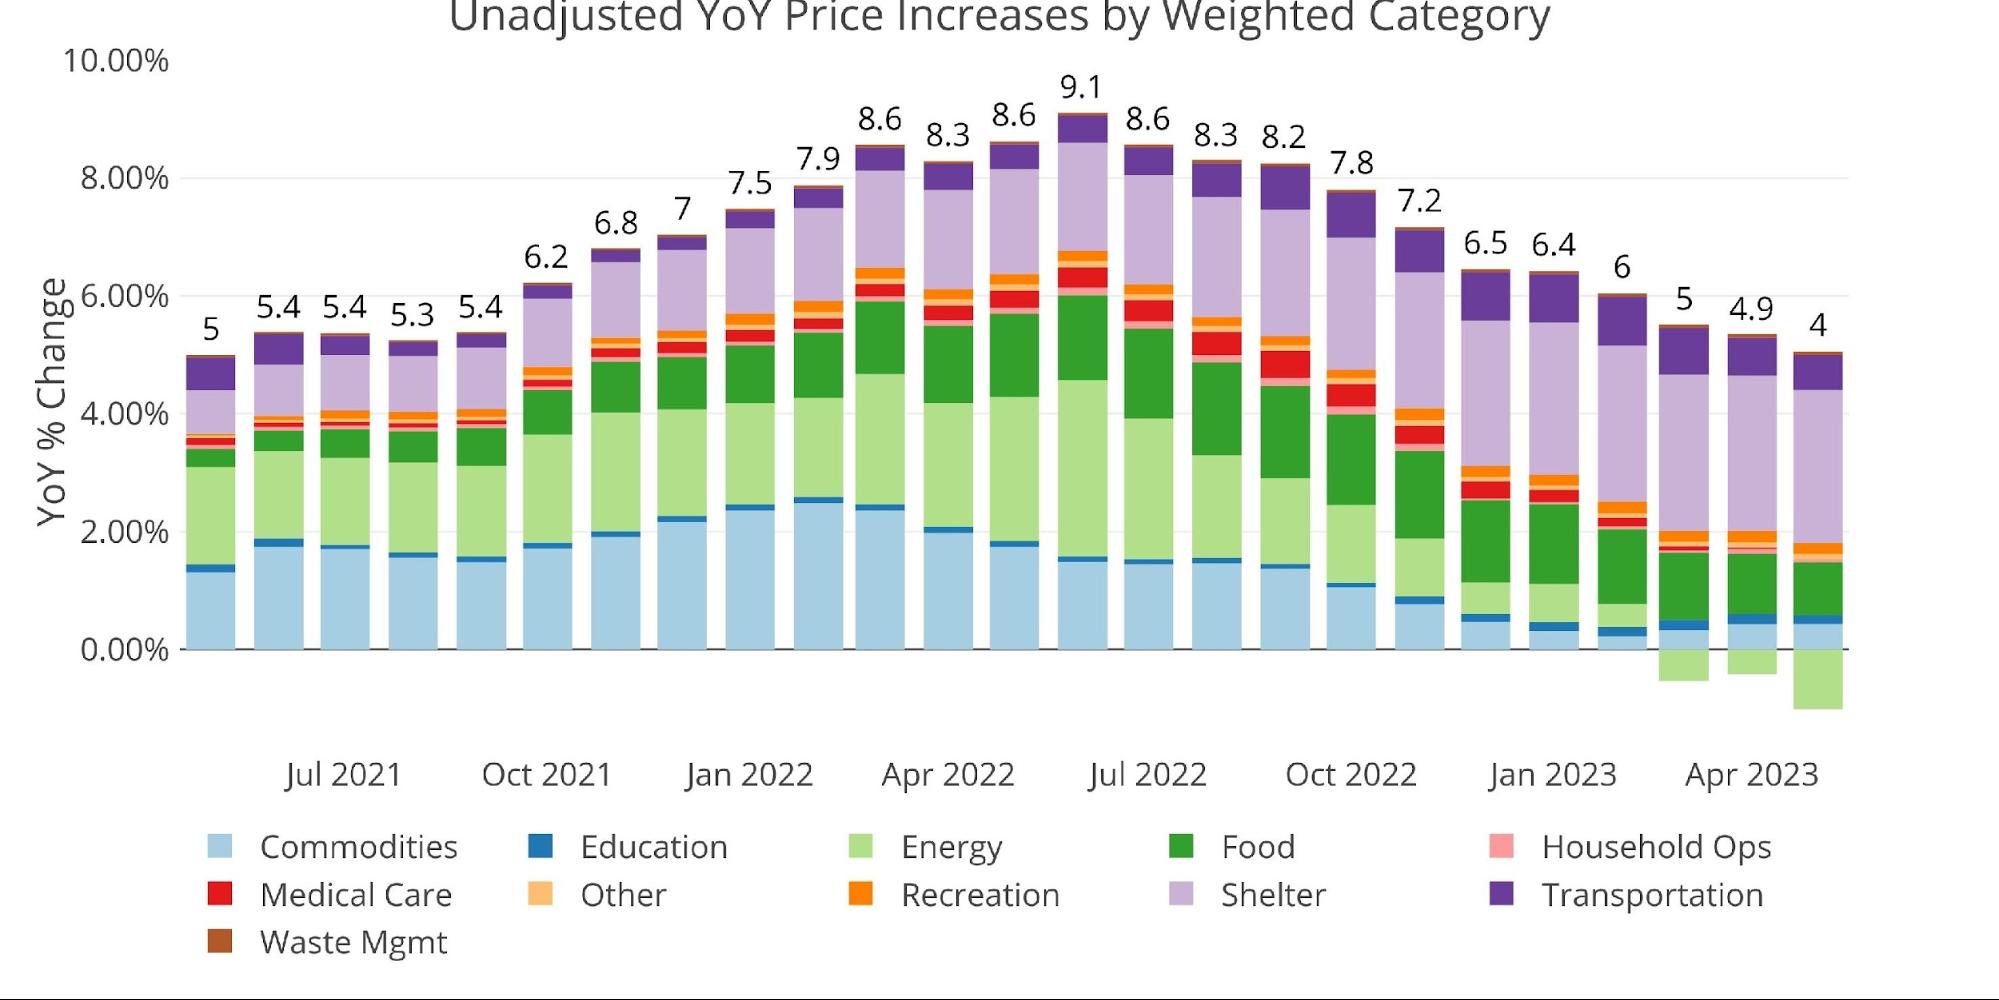
Figure: 3 Year Over Year Inflation
Looking at the 12-month trend shows multiple categories are near or above their 12-month trends. This is particularly concerning in Commodities which represent 21.3% of the CPI. Shelter was slightly below the 12-month trend at 0.6%. This still annualized to a 7.4% increase in Shelter. This is especially dangerous in the CPI formula because it makes up 34.6% of the CPI calculation.
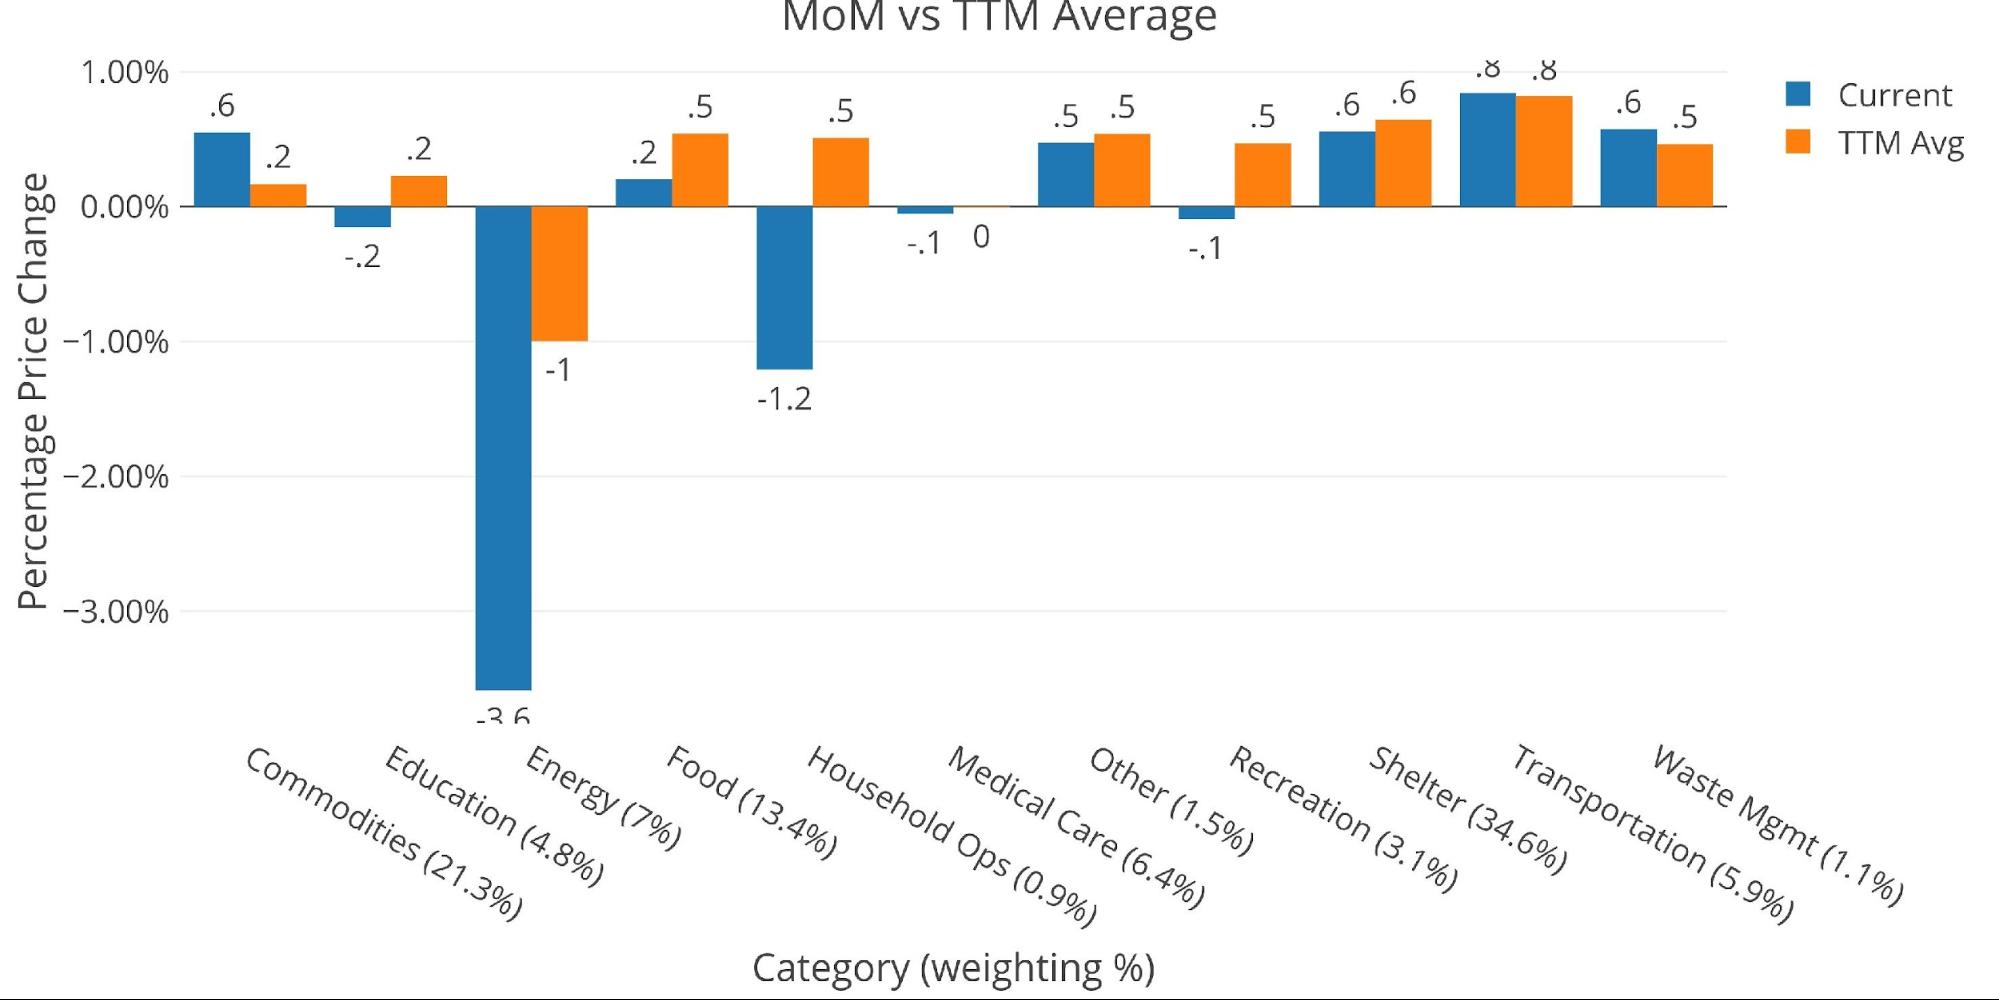
Figure: 4 MoM vs TTM
The table below gives a more detailed breakdown of the numbers. It shows the actual figures reported by the BLS side by side with the recalculated and unrounded numbers. The weighted column shows the contribution each value makes to the aggregated number. Details can be found on the BLS Website.
Some key takeaways:
-
- Commodities and Shelter combined to add .31% to the CPI this month on their own
- Shelter was higher than last month by 0.13% which is a bad sign for a Fed that is hoping their inflation fight is close to over
- Food was up 0.2% which annualizes to a 2.42% increase. This is helping lower the YoY Food CPI component which was up 6.7% YoY. This compares to 10.12% from May 2022
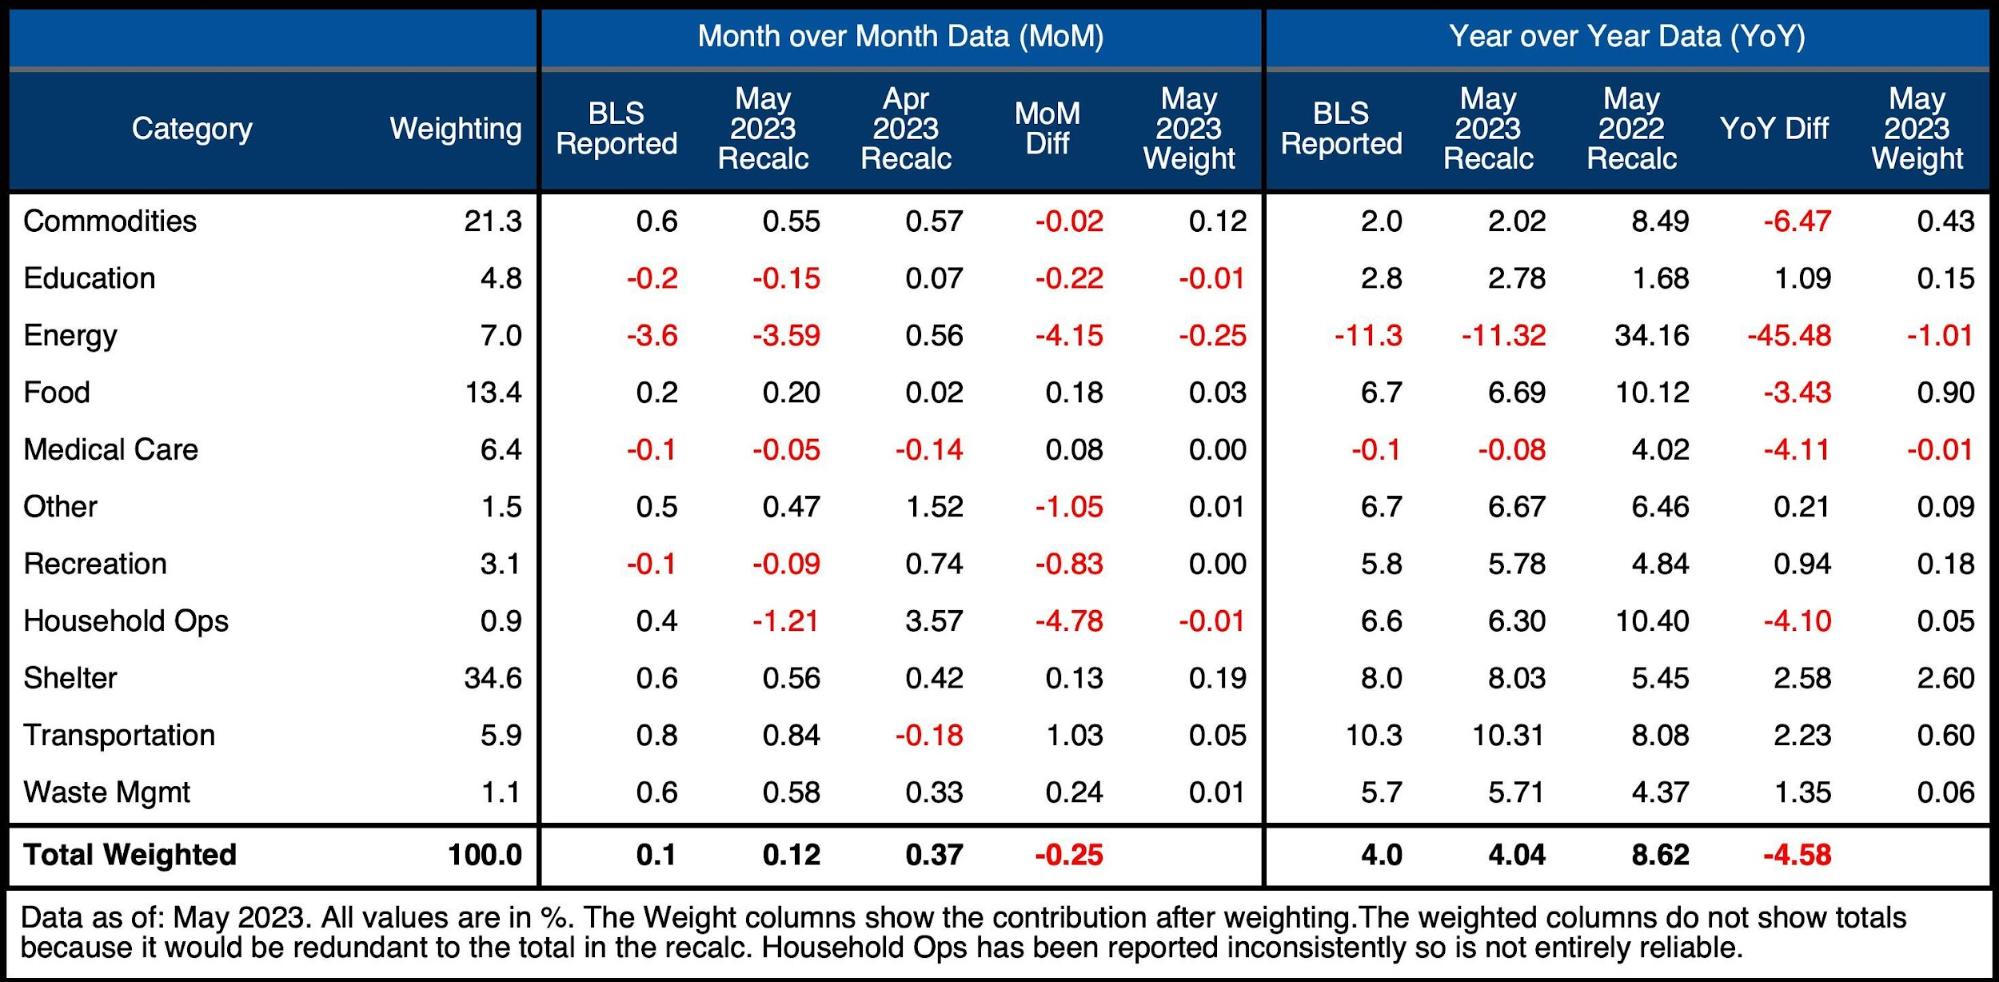
Figure: 5 Inflation Detail
Looking at the Fed Numbers
The Fed is actually looking at a much rosier picture. They use a different category methodology than the BLS, but the total number ties. According to the Fed categories, only Apparel and Medical Care are showing above trend.
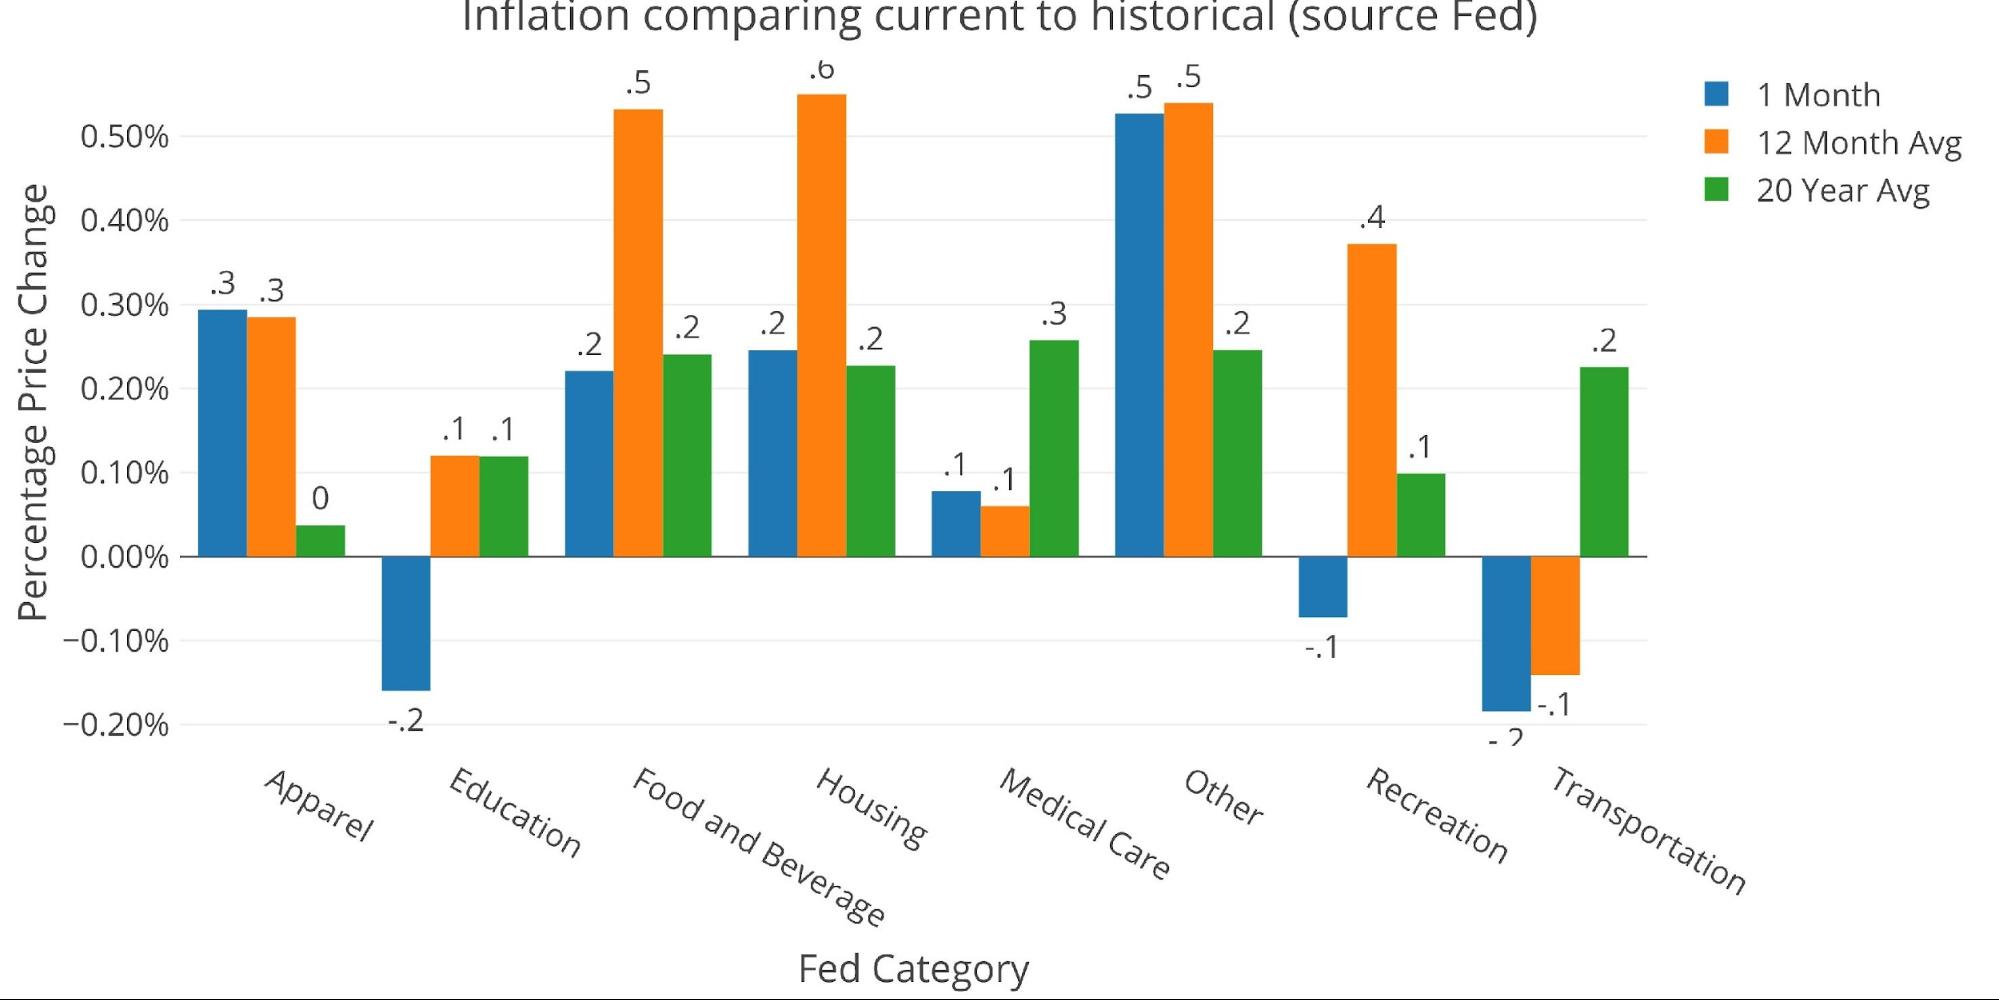
Figure: 6 Current vs History
Fed Historical Perspective
The Fed has finally seen the Fed Funds rate jump above the rate of inflation. This is the longest it has ever taken the Fed to raise the Fed Funds above the inflation rate. What history shows is that spikes in the Fed Funds rate are usually followed by similar moves down. The Fed will likely have to drop rates again soon in response to something breaking in the market. History also shows that inflation typically picks up after the Fed pursues that strategy. This is probably why they are telegraphing “higher for longer”, but that will be much harder to do in practice.
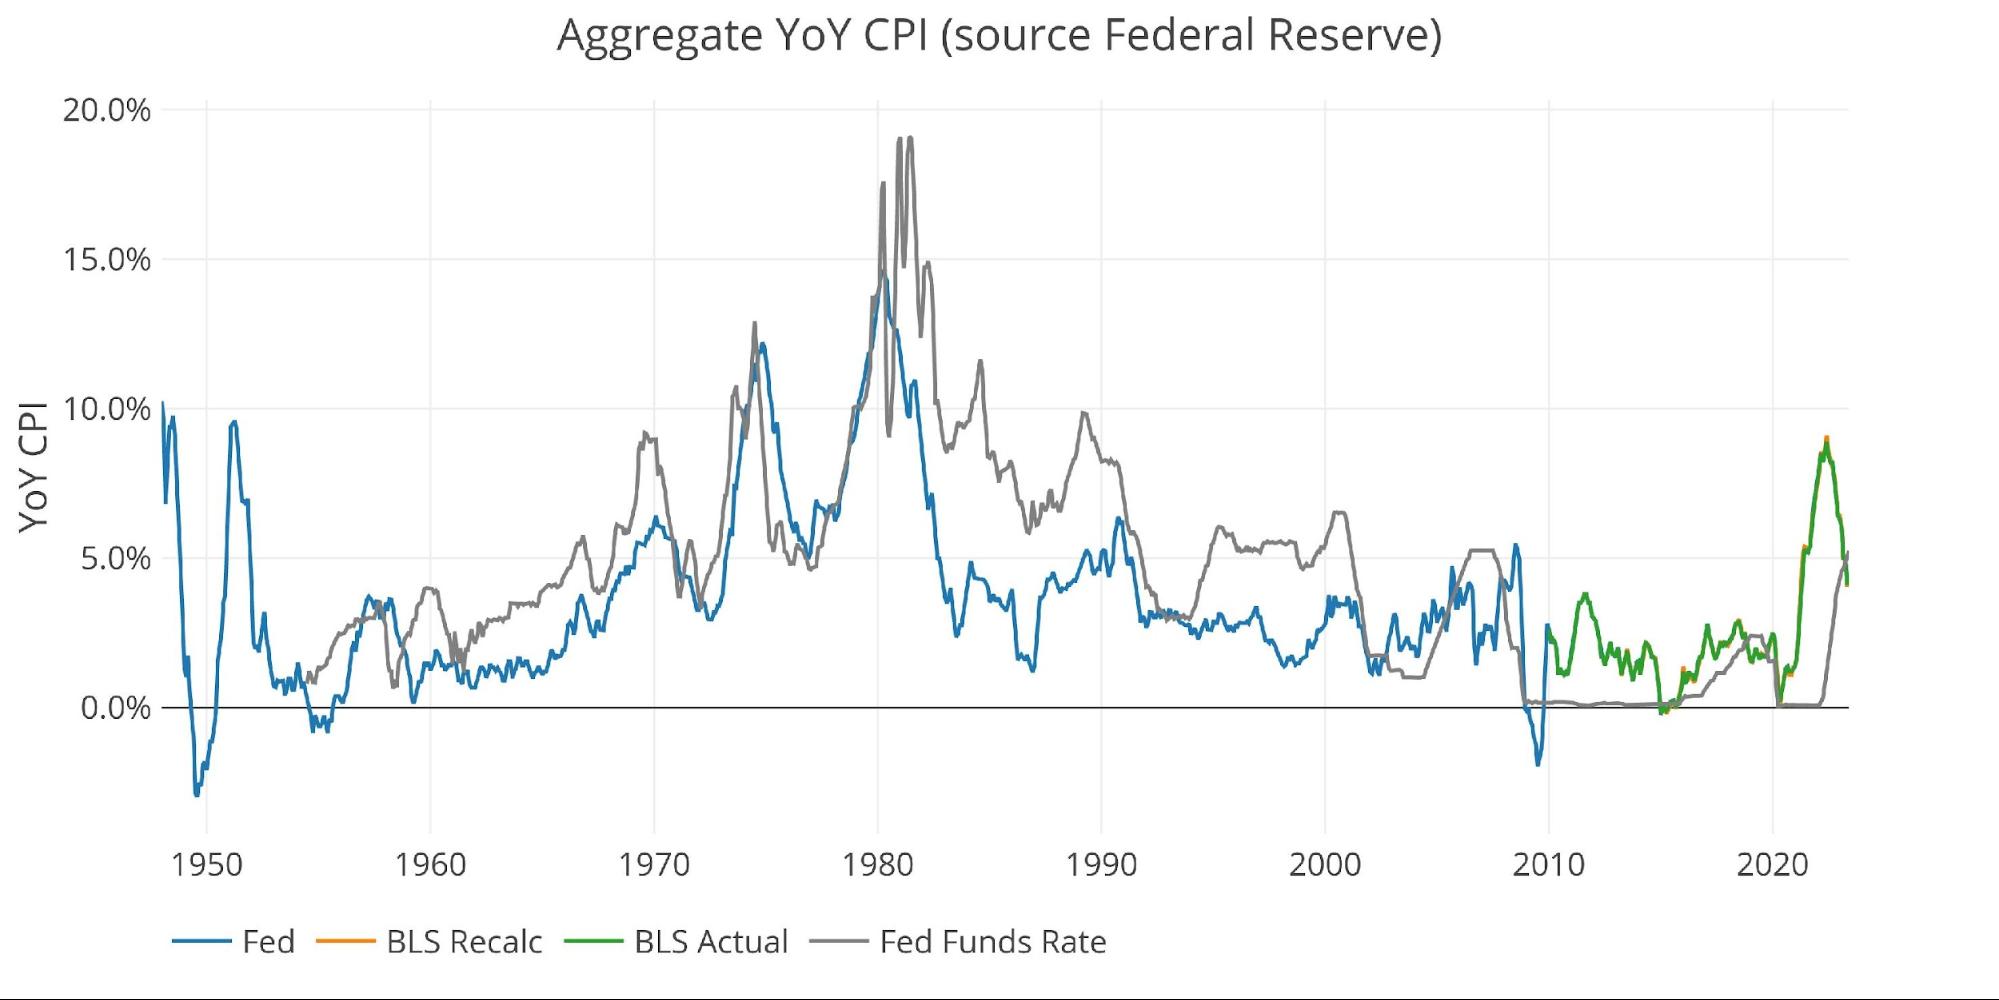
Figure: 7 Fed CPI
BLS Historical Perspective
As the chart below shows, the CPI really popped in early 2021. Based on the recent numbers coming in, it does not look like the CPI will see a similar fall to undo the initial pop. Instead, the price increases look sticky and long-lasting. This is because the only components dragging the CPI back down are Commodities and Energy. The components remaining elevated now are stickier and harder to bring down (e.g., Shelter).
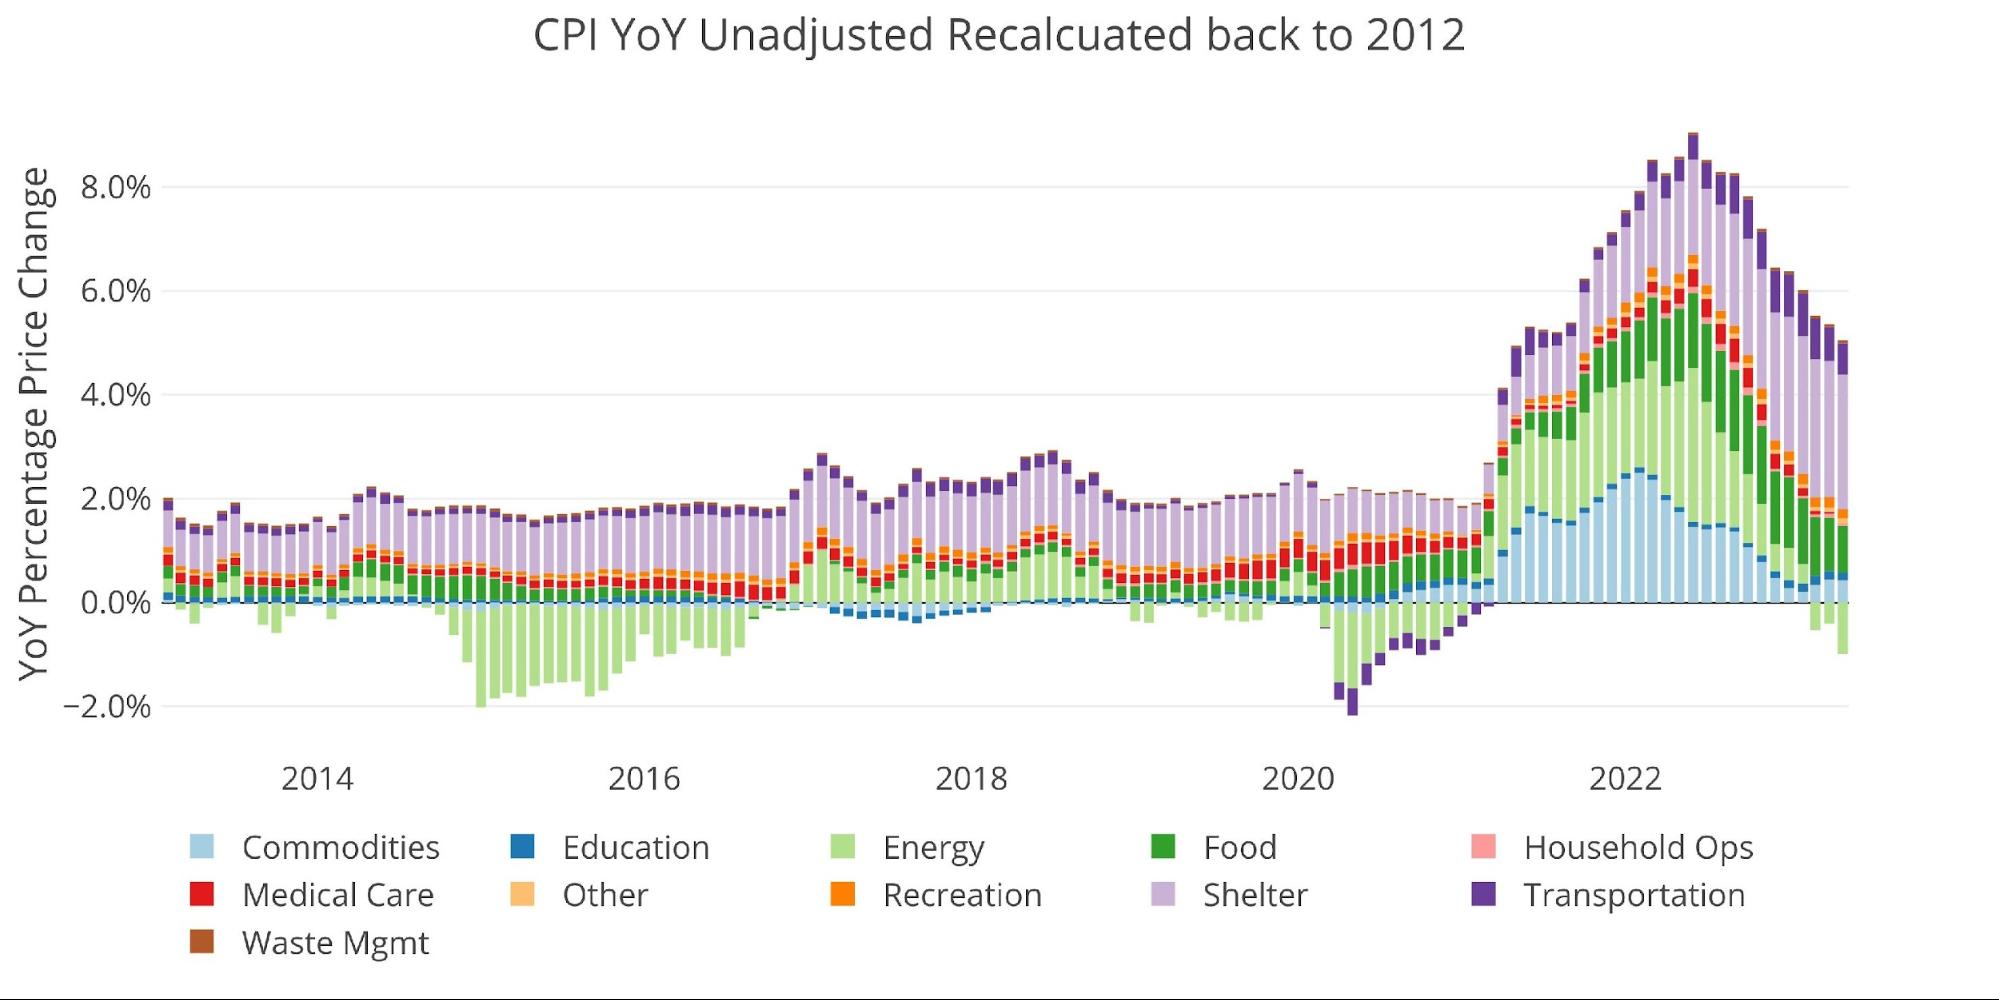
Figure: 8 Historical CPI
Wrapping Up
Bottom line, the monthly CPI was much worse when looking underneath the surface. The headline .12% is very deceiving, dragged down by a big drop in Energy. The drop in Energy looks like it is also being influenced by the use of the SPR.
The YoY drop was expected and makes sense. Next month will likely see an even bigger drop. Going into July, the YoY might start moving back up. At this point, the Fed will really be in a tight spot. According to the current messaging, the market will expect them to keep raising. The economy cannot handle the current level of rates. Thus, either the Fed folds and pivots or they will have massive market turmoil on their hands. Unfortunately, at this point, that turmoil is coming regardless.
Data Source: https://www.bls.gov/cpi/ and https://fred.stlouisfed.org/series/CPIAUCSL
Data Updated: Monthly within first 10 business days
Last Updated: May 2023
Interactive charts and graphs can always be found on the Exploring Finance dashboard: https://exploringfinance.shinyapps.io/USDebt/

Call 1-888-GOLD-160 and speak with a Precious Metals Specialist today!
Buka akaun dagangan patuh syariah anda di Weltrade.
Source link