Get our trading strategies with our monthly & weekly forecast of currency pairs worth watching using support & resistance for the week of February 14, 2022.

This week I will begin with my monthly and weekly forecasts of the currency pairs worth watching. The first part of my forecast is based upon my research of the past 20 years of Forex prices, which show that the following methodologies have all produced profitable results:
Let us look at the relevant data of currency price changes and interest rates to date, which we compiled using a trade-weighted index of the major global currencies:

Monthly Forecast February 2022
For the month of February, I forecasted that the EUR/USD currency pair will fall in value. The performance to date of this forecast is as follows:
|
Currency Pair |
Forecast Direction |
Interest Rate Differential |
Performance to Date |
|
EUR/USD |
Short ↓ |
+0.25% (0.25% – 0.00%) |
-1.00% |
Weekly Forecast 13th February 2022
In my previous forecast last week, I predicted that the GBP/SEK currency cross was likely to rise in value, due to its unusually strong counter-trend movement over the previous week. Fading strong weekly counter-trend price movements is the basis of my weekly trading strategy.
This was a nicely profitable call, as the GBP/SEK currency cross rose by 2.34% last week.
I make no forecast this week.
The Forex market saw its level of directional volatility fall last week, as I had expected, with only 30% of all the important currency pairs or crosses moving by more than 1% in value. Directional volatility is likely to increase over this coming week, as there are some high-impact events scheduled.
Last week was dominated by relative strength in the Australian dollar, and relative weakness in the euro.
You can trade our forecasts in a real or demo Forex brokerage account.
Key Support/Resistance Levels for Popular Pairs
I teach that trades should be entered and exited at or very close to key support and resistance levels. There are certain key support and resistance levels that can be watched on the more popular currency pairs this week.
|
Currency Pair |
Key Support / Resistance Levels |
|
AUD/USD |
Support: 0.7106, 0.7082, 0.7006, 0.6963 Resistance: 0.7183, 0.7293, 0.7321, 0.7344 |
|
EUR/USD |
Support: 1.1330, 1.1279, 1.1195, 1.1183 Resistance: 1.1368, 1.1418, 1.1671, 1.1688 |
|
GBP/USD |
Support: 1.3458, 1.3401, 1.3375, 1.3340 Resistance: 1.3664, 1.3769, 1.3852, 1.3898 |
|
USD/JPY |
Support: 115.23, 114.80, 114.55, 114.23 Resistance: 115.50, 115.71, 115.95, 116.29 |
|
AUD/JPY |
Support: 82.04, 80.79, 80.40, 79.81 Resistance: 82.55 83.21, 83.75, 84.35 |
|
EUR/JPY |
Support: 130.62, 130.00, 129.31, 128.30 Resistance: 132.00, 132.35, 133.63, 134.16 |
|
USD/CAD |
Support: 1.2645, 1.2535, 1.2498, 1.2372 Resistance: 1.2812, 1.2901, 1.2959, 1.3025 |
|
USD/CHF |
Support: 0.9221, 0.9216, 0.9159, 0.9072 Resistance: 0.9291, 0.9370, 0.9387, 0.9438 |
Let us see how trading reversals from two of last week’s key levels could have worked out:
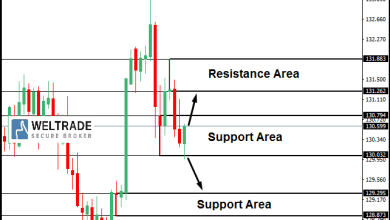
USD/JPY
I had expected the level at 116.29 might function as resistance, as it had acted previously as both support and resistance. Note how these “flipping” levels can work well. The H1 chart below shows how the price rejected this level with a near-doji pin bar right at the start of last Thursday’s New York session (typically a great time to enter trades in a major Forex currency pair involving the USD such as this one), marked by the down arrow in the price chart below. This trade has been nicely profitable, achieving a maximum positive risk reward ratio of more than 5 to 1 based upon the size of the entry candlestick.

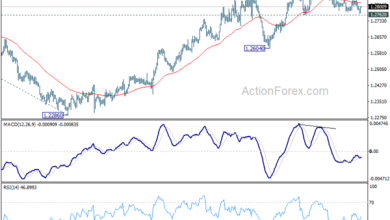
USD/CAD
I had expected the level at 1.2645 might function as support, as it had acted previously as both support and resistance. Note how these “flipping” levels can work well. The H1 chart below shows how the price rejected this level with a reversal combination of an inside bar followed by an outside bar right around last Thursday’s London close, marked by the up arrow in the price chart below. This trade has been profitable, achieving a maximum positive risk reward ratio of more than 1 to 1 based upon the size of the entry candlestick.

That is all for this week. You can trade my forecasts in a real or demo Forex brokerage account to test the strategies and strengthen your self-confidence before investing real funds.
Source link