
The technical analysis last month was published when gold was around $1975 and concluded:
The indicators are now mostly neutral with a bearish lean. There are some slightly bullish indicators, but nothing strong enough to give a clear signal. This suggests the price could drift lower until it finds the right catalyst to reverse. There should be plenty of catalysts on the horizon, but the biggest one will be how the Fed responds to the next crisis. Until then, pressure is pointing downward.
That conclusion has been accurate over the last month as the price has drifted lower with any rallies being sold. Despite the weakness, it’s hard to be bearish on gold considering how well it has held up in the face of a still hawkish Fed. So, has the picture changed? Let’s look at the data…
Resistance and Support
Gold
The shorts broke through $1950 which has now become resistance. They have been unable to make a push towards $1900 (yet?) while the longs have not had any momentum to challenge the $1950 level with any conviction. Pressure still looks slightly down, but the shorts are not as confident as they were a month ago. Price action suggests a sideways movement for now.
Outlook: Neutral
Silver
Silver shorts now have eyes set on $22 which has been a battleground for several years now. The longs might have thought $22 was in the rear-view mirror, but silver always has a way of extending further than most think. Similar to gold, the shorts seem to be running out of momentum, especially with all the news in their favor. That said, the bulls seem only willing to hold the line and not push higher.
Outlook: Neutral
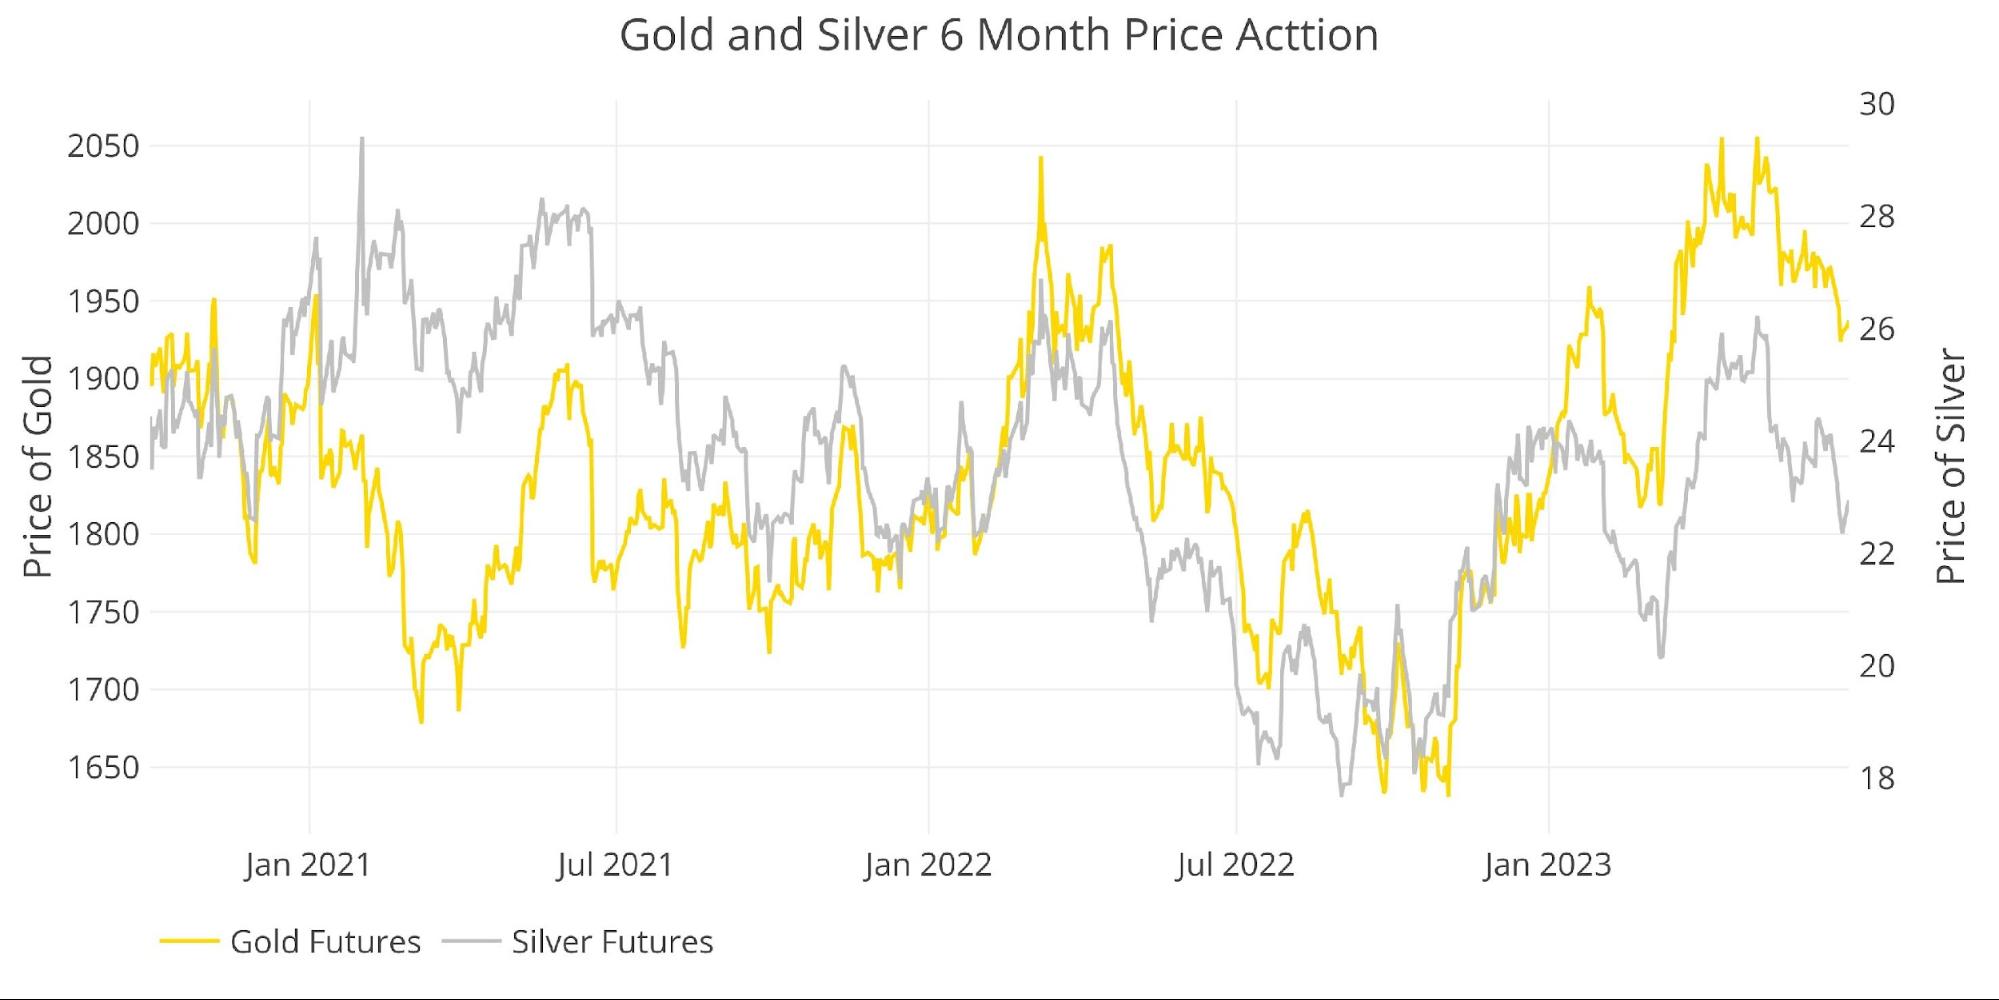
Figure: 1 Gold and Silver Price Action
Daily Moving Averages (DMA)
Gold
As mentioned last month and the month before, gold moved too far too fast. It got way ahead of the moving averages and needed time to consolidate. It has now taken that time, even drifting below the 50 DMA. The averages still show a very bullish posture and the consolidation is looking similar to 2019. The 200 DMA might need a bit more time to catch up with the 50 DMA, but the correction looks much closer to the end than the beginning. Shorting is a bad idea, but aggressive long positions might be premature.
Outlook: Neutral with a bullish lean

Figure: 2 Gold 50/200 DMA
Silver
The silver price is now challenging the 200 DMA while the 50 DMA is well higher. If silver can hold the 200 DMA then it would be a sign that the correction has been completed.
Outlook: Wait and See
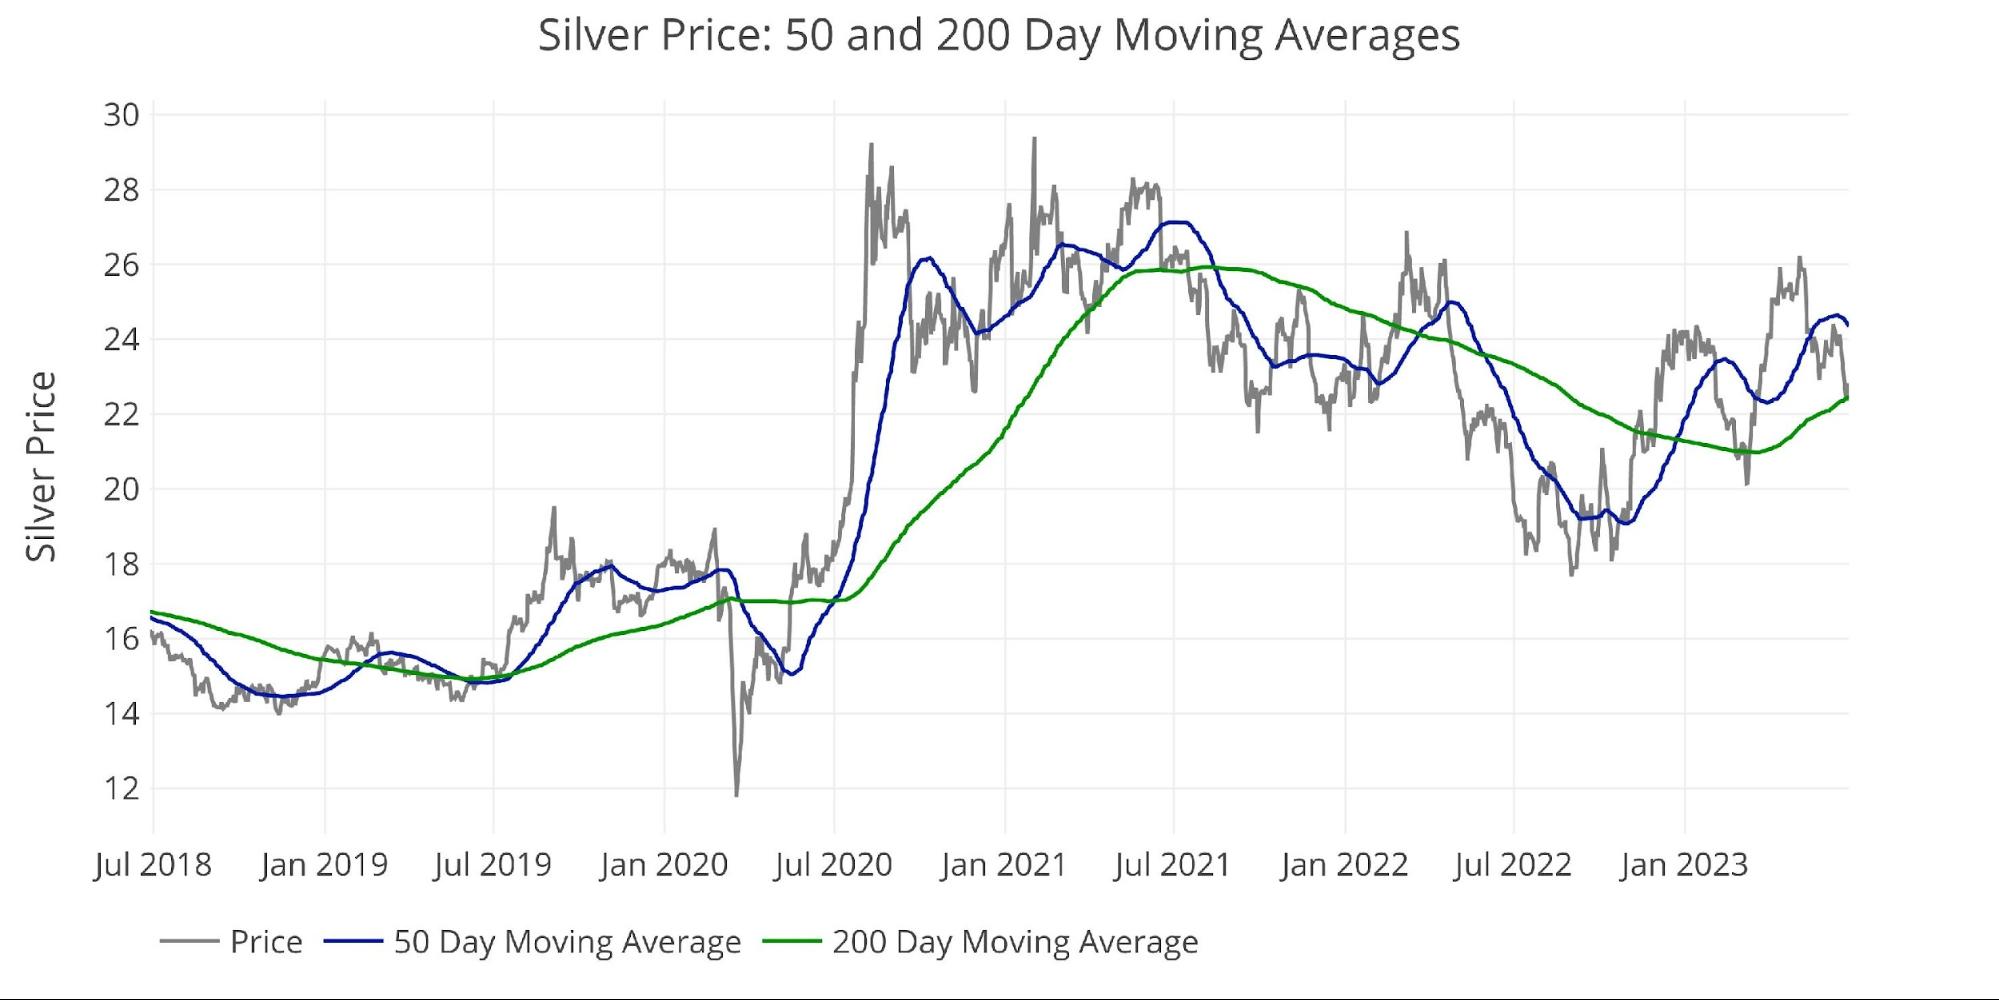
Figure: 3 Silver 50/200 DMA
Comex Open Interest
Gold
Open interest is near the lowest level in years, yet the price of gold has remained high. This is a very bullish position. The last time open interest was this low, gold was trading in the low $1800s. The spec longs have abandoned their positions without crashing the price. This means there is plenty of speculative dry powder on the sidelines which could create a price explosion from an elevated level if gold got the catalyst it needs.
Outlook: Very bullish
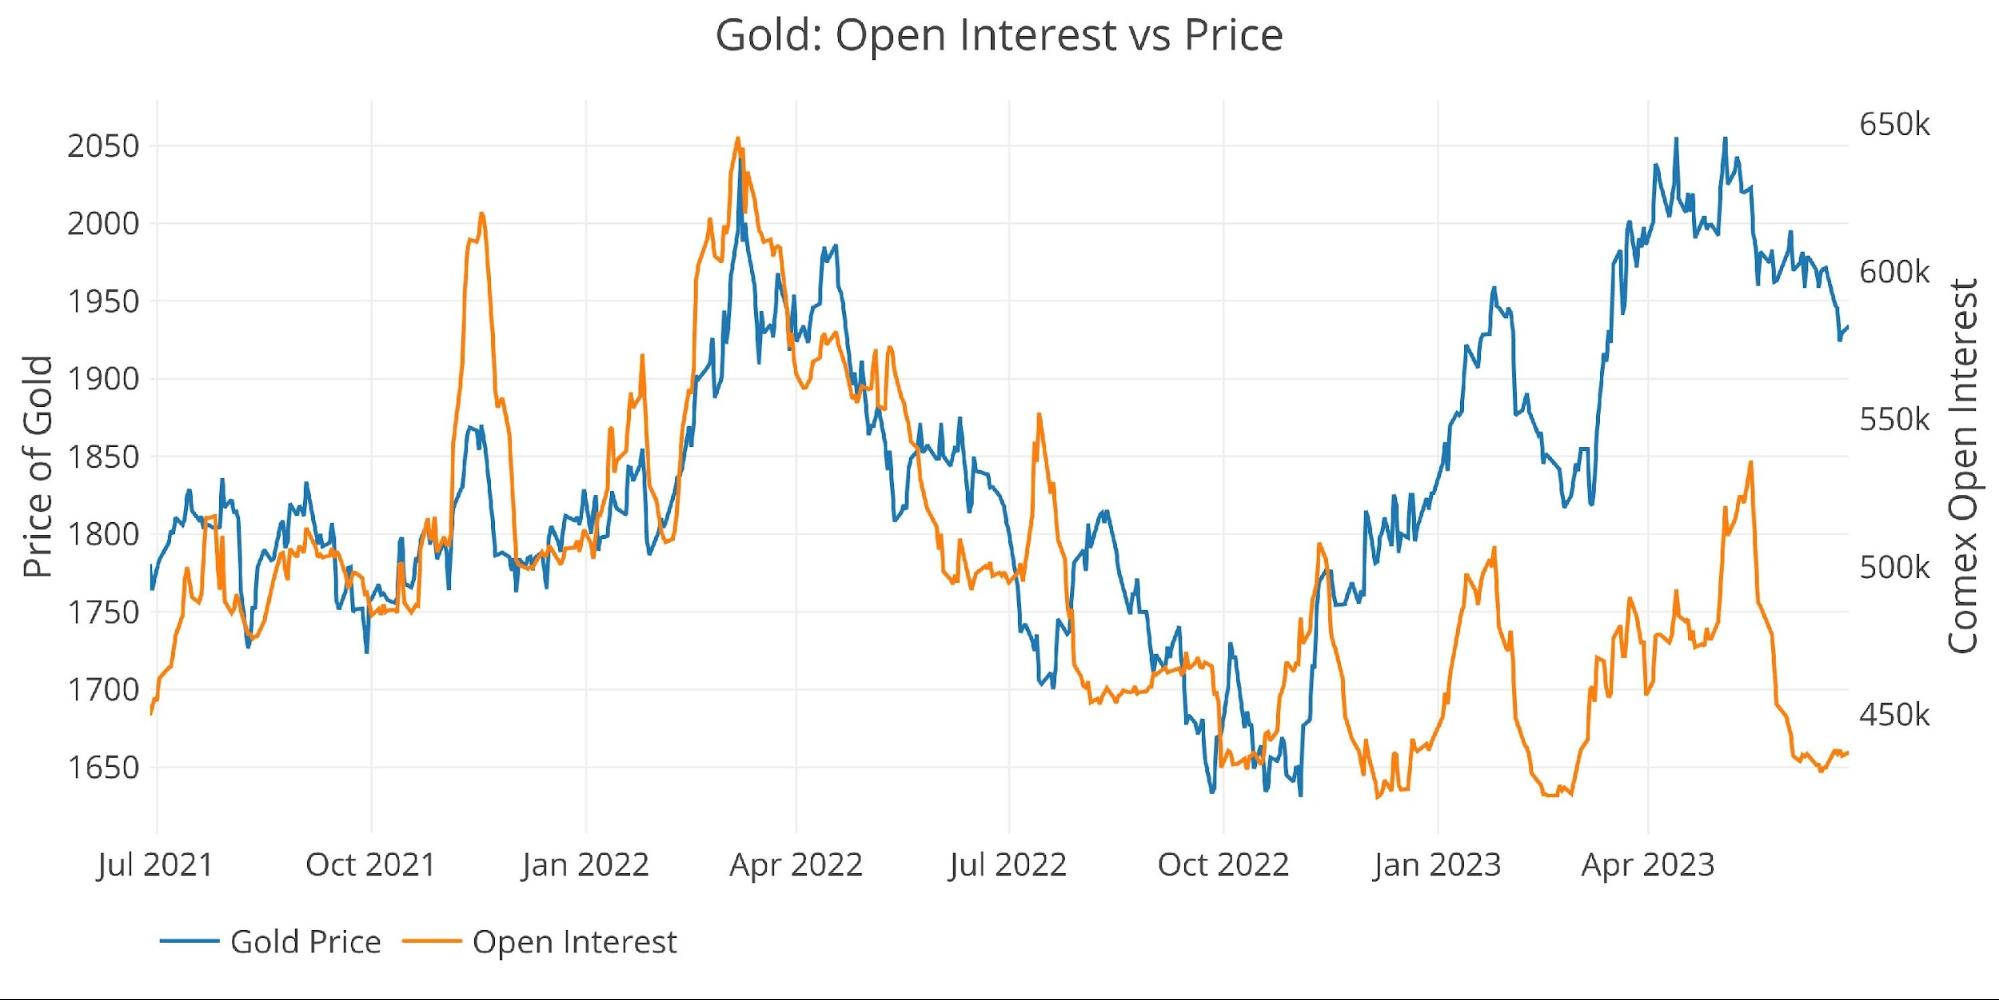
Figure: 4 Gold Price vs Open Interest
Silver
The chart in silver is not nearly as bullish as gold. The open interest remains well above the lows seen earlier this year which means there could still be enough speculative money in silver to take the price another leg lower if the long traders bail. That said, open interest is not elevated and was at depressed levels earlier this year. This leaves more room for the upside than the downside.
Outlook: Slightly bullish
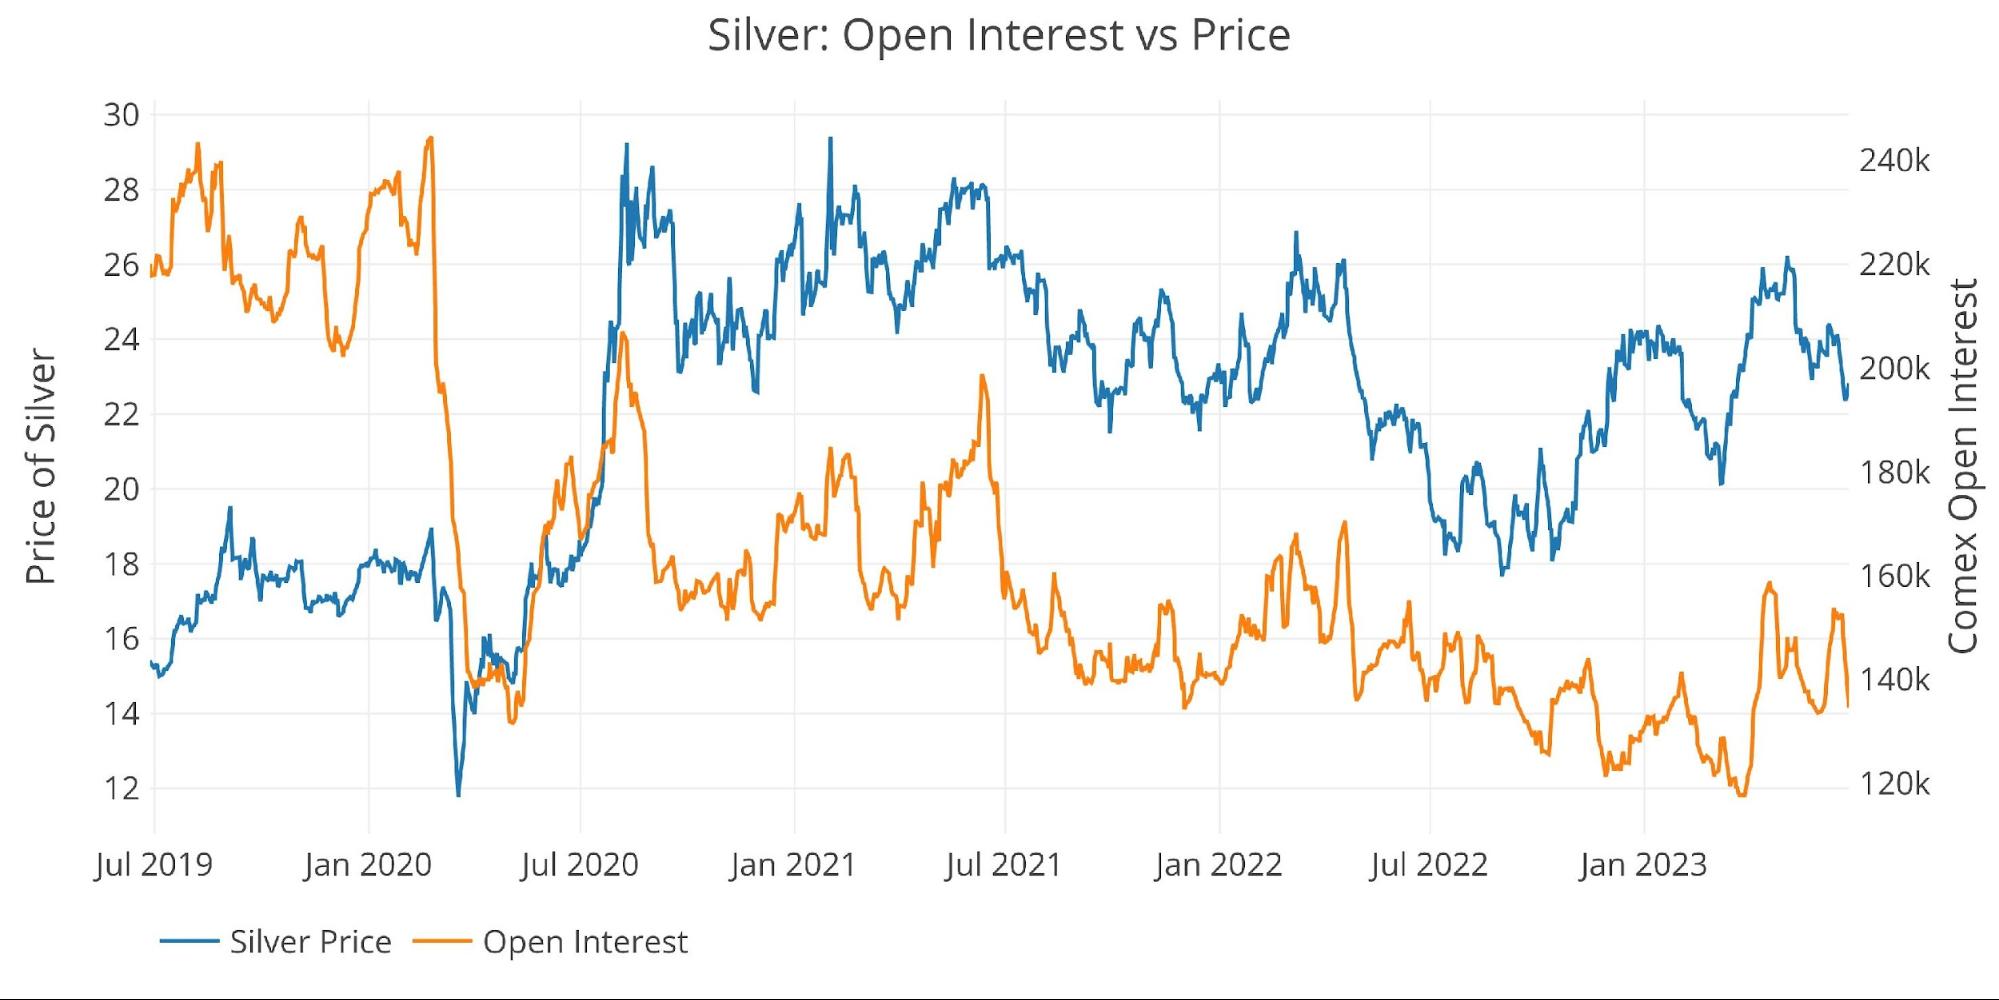
Figure: 5 Silver Price vs Open Interest
Margin Rates and Open Interest
Gold
Margin rates were raised 5 times in 6 months to try and blunt the ongoing price advance. The elevated rates could be one reason that open interest has gotten so low. The CFTC is at the higher end of the historic range with gold prices remaining elevated. Considering the price is still over $1900, there is less room for the CFTC to raise the margin to push down prices. Removing potential price advance barriers leaves a bullish setup.
Outlook: Bullish
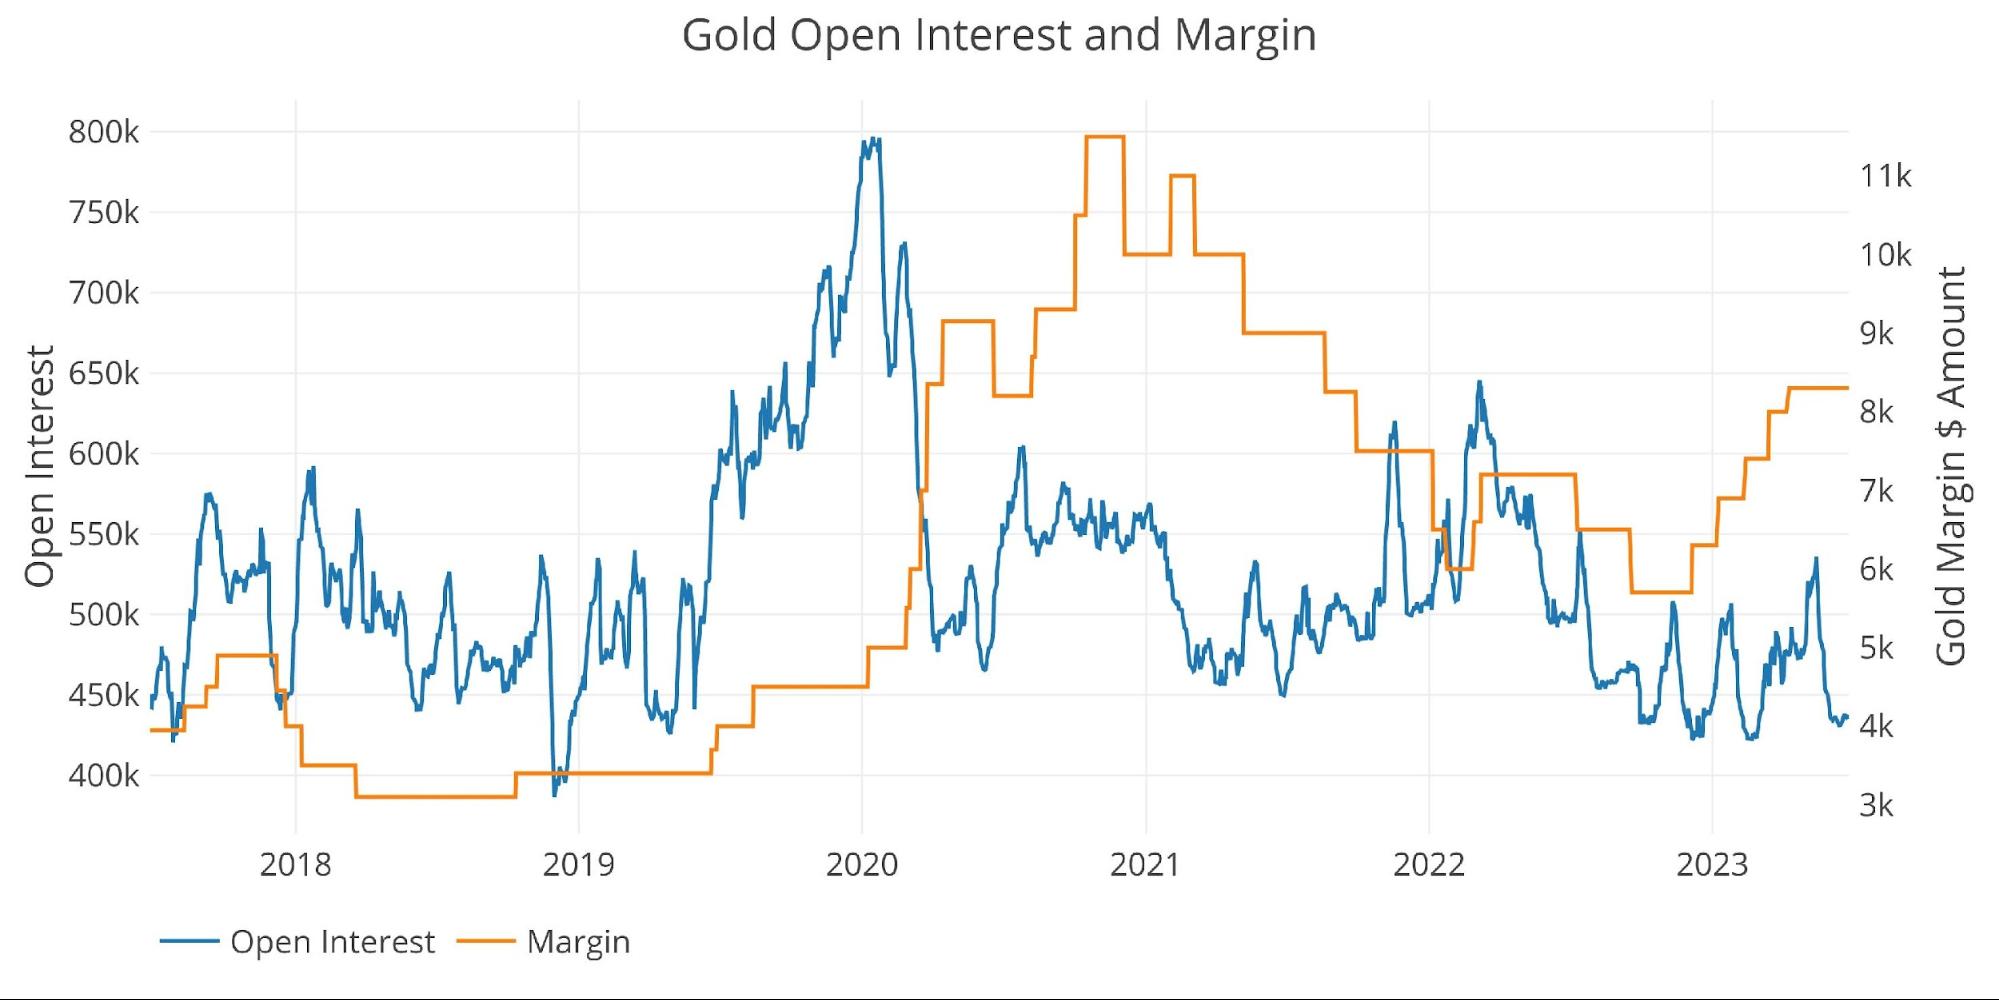
Figure: 6 Gold Margin Dollar Rate
Silver
The CFTC has not had to raise margin rates in silver to bring the price back down. There have only been two increases since July last year. This means the CFTC has plenty of firepower to slow silver price advances by raising margin requirements.
Outlook: Bearish
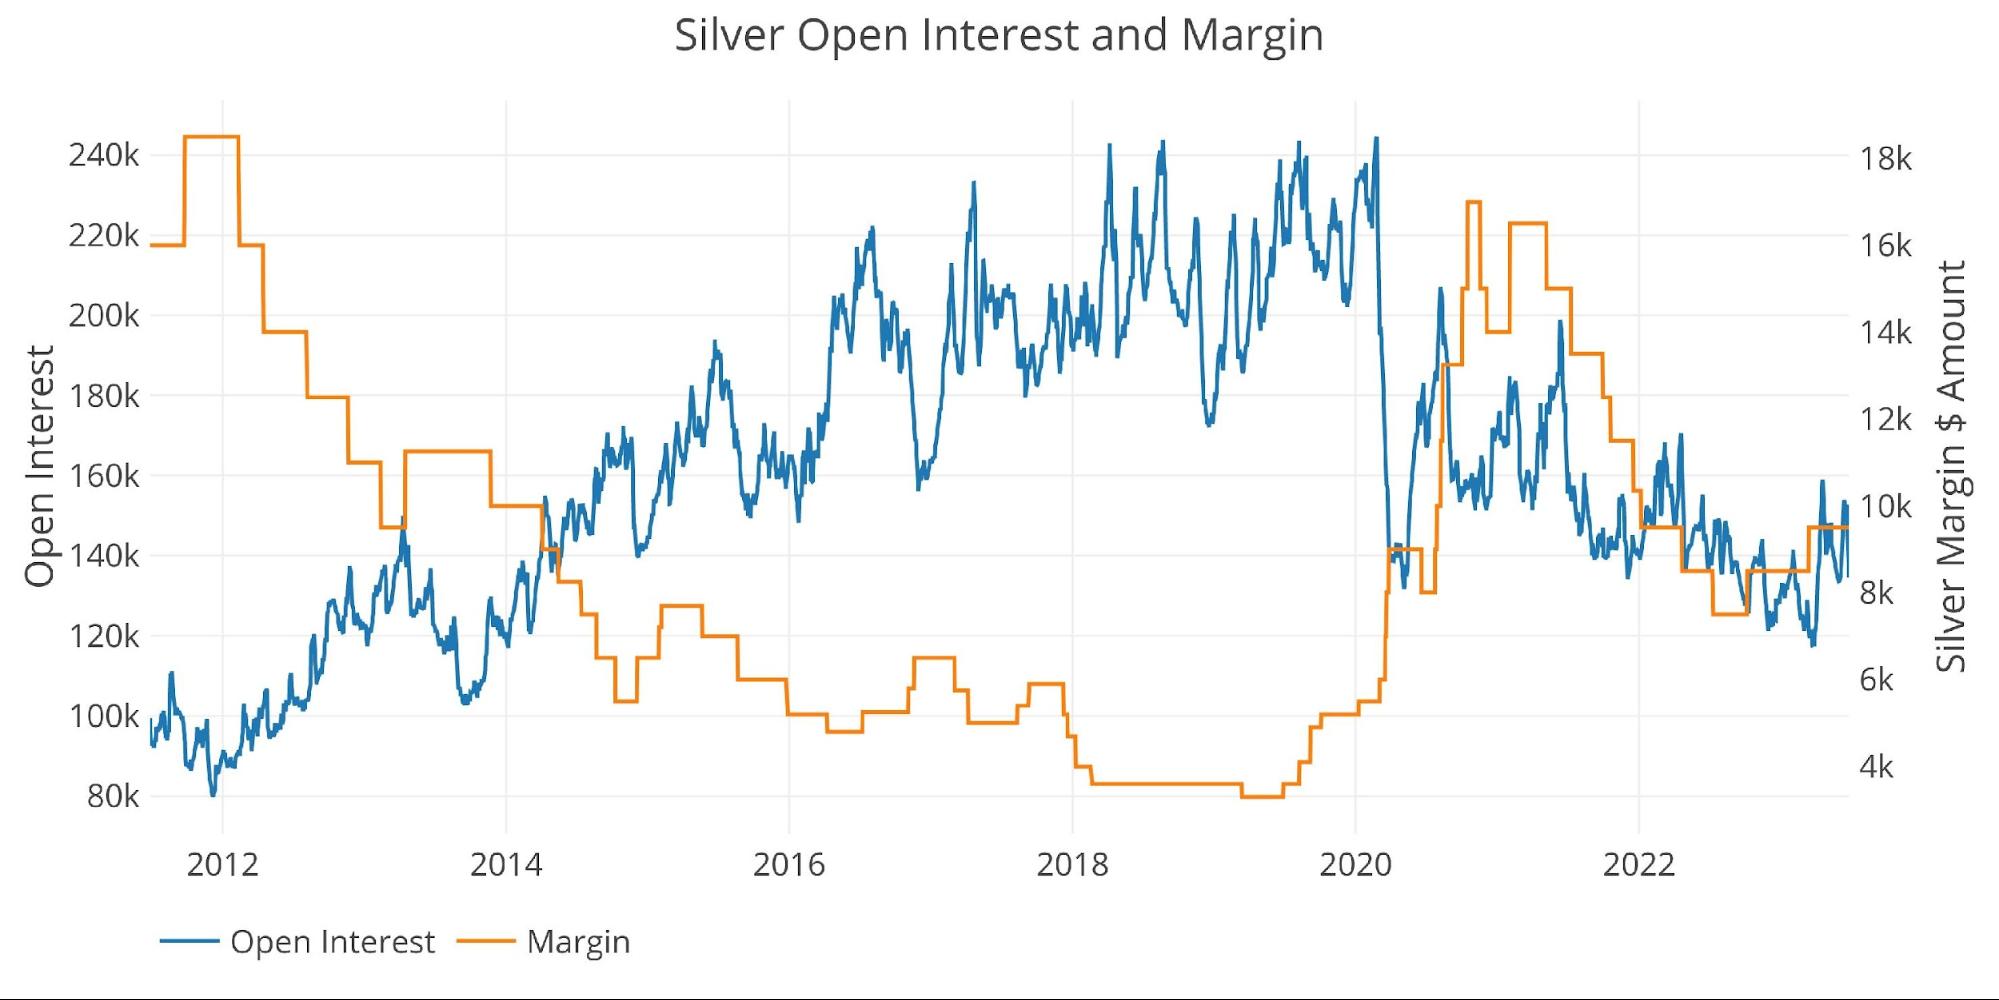
Figure: 7 Silver Margin Dollar Rate
Gold Miners (Arca Gold Miners Index)
The gold miners have been consistently leading the price of gold in both directions for years. This current move has been no different as the miners have been absolutely crushed by the current correction.
The miners have been unable to find a bottom and continue to drift lower. This is not a good sign for gold.
Outlook: Bearish
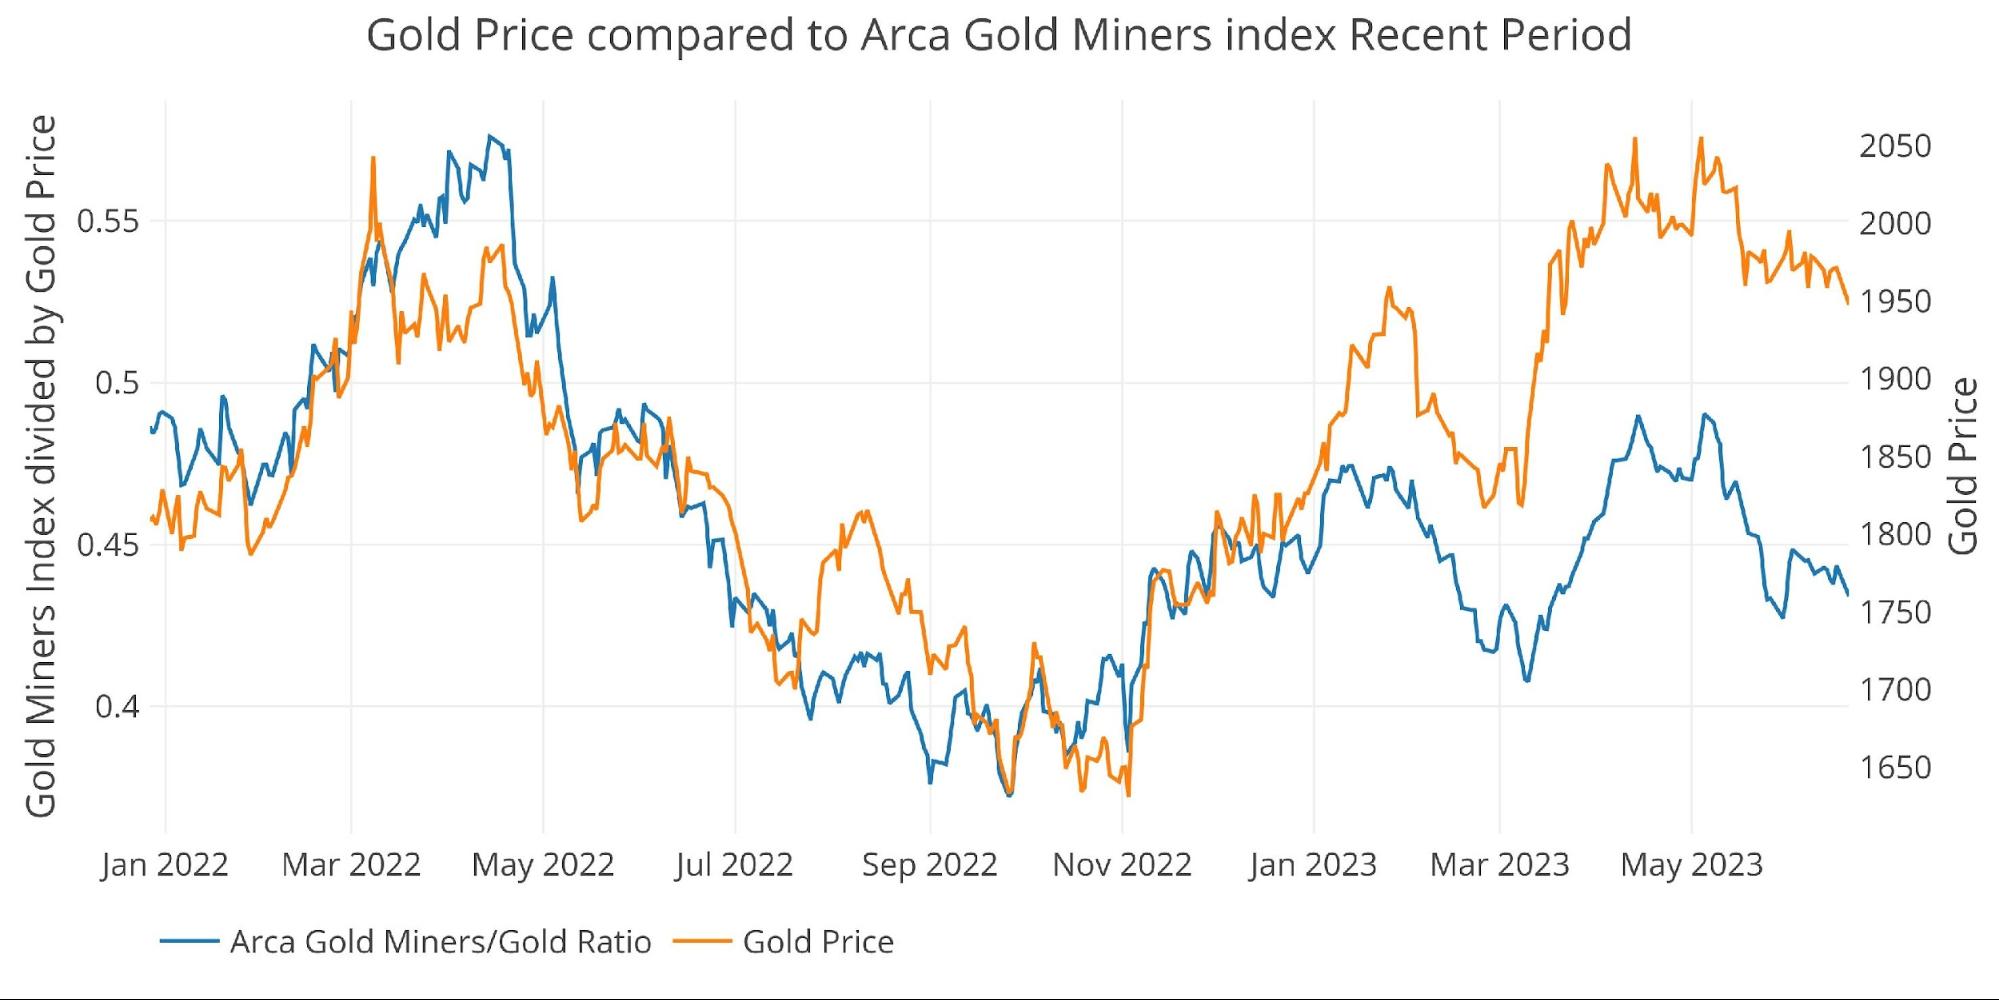
Figure: 8 Arca Gold Miners to Gold Current Trend
The chart below shows the longer-term historical relationship. The miners have been absolutely punished over the last decade as stock traders have never bought into the current move in gold. That leaves these stocks deeply undervalued and set up for an explosive move when the gold price takes off.
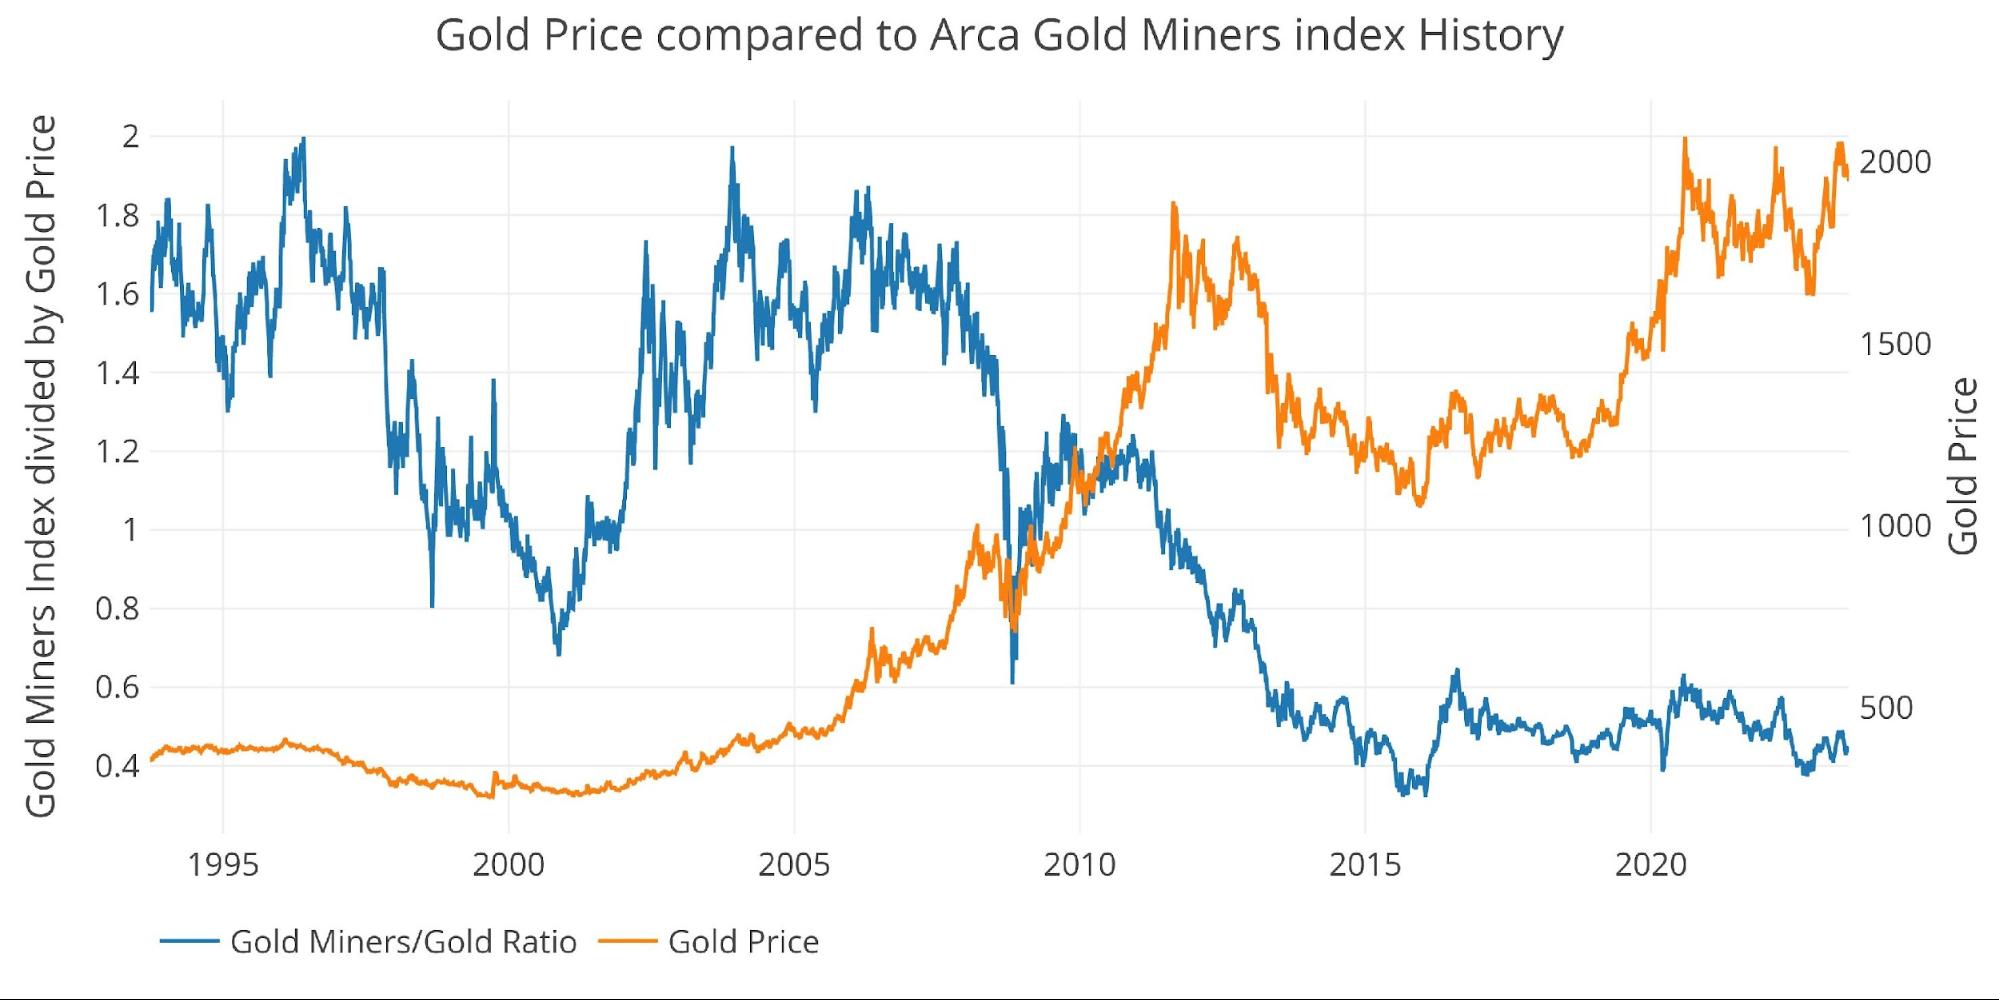
Figure: 9 Arca Gold Miners to Gold Historical Trend
Trade Volume
Love or hate the traders/speculators in the paper futures market, but it’s impossible to ignore their impact on price. The charts below show more activity tends to drive prices higher.
Volume in gold picked up some last week but did not drive a meaningful increase in open interest. With summer getting fully underway, volume might stay lower for longer, but probably cannot go too much lower. If there is less room for something to go down, then the opportunity is to the upside.
Outlook: Slightly Bullish
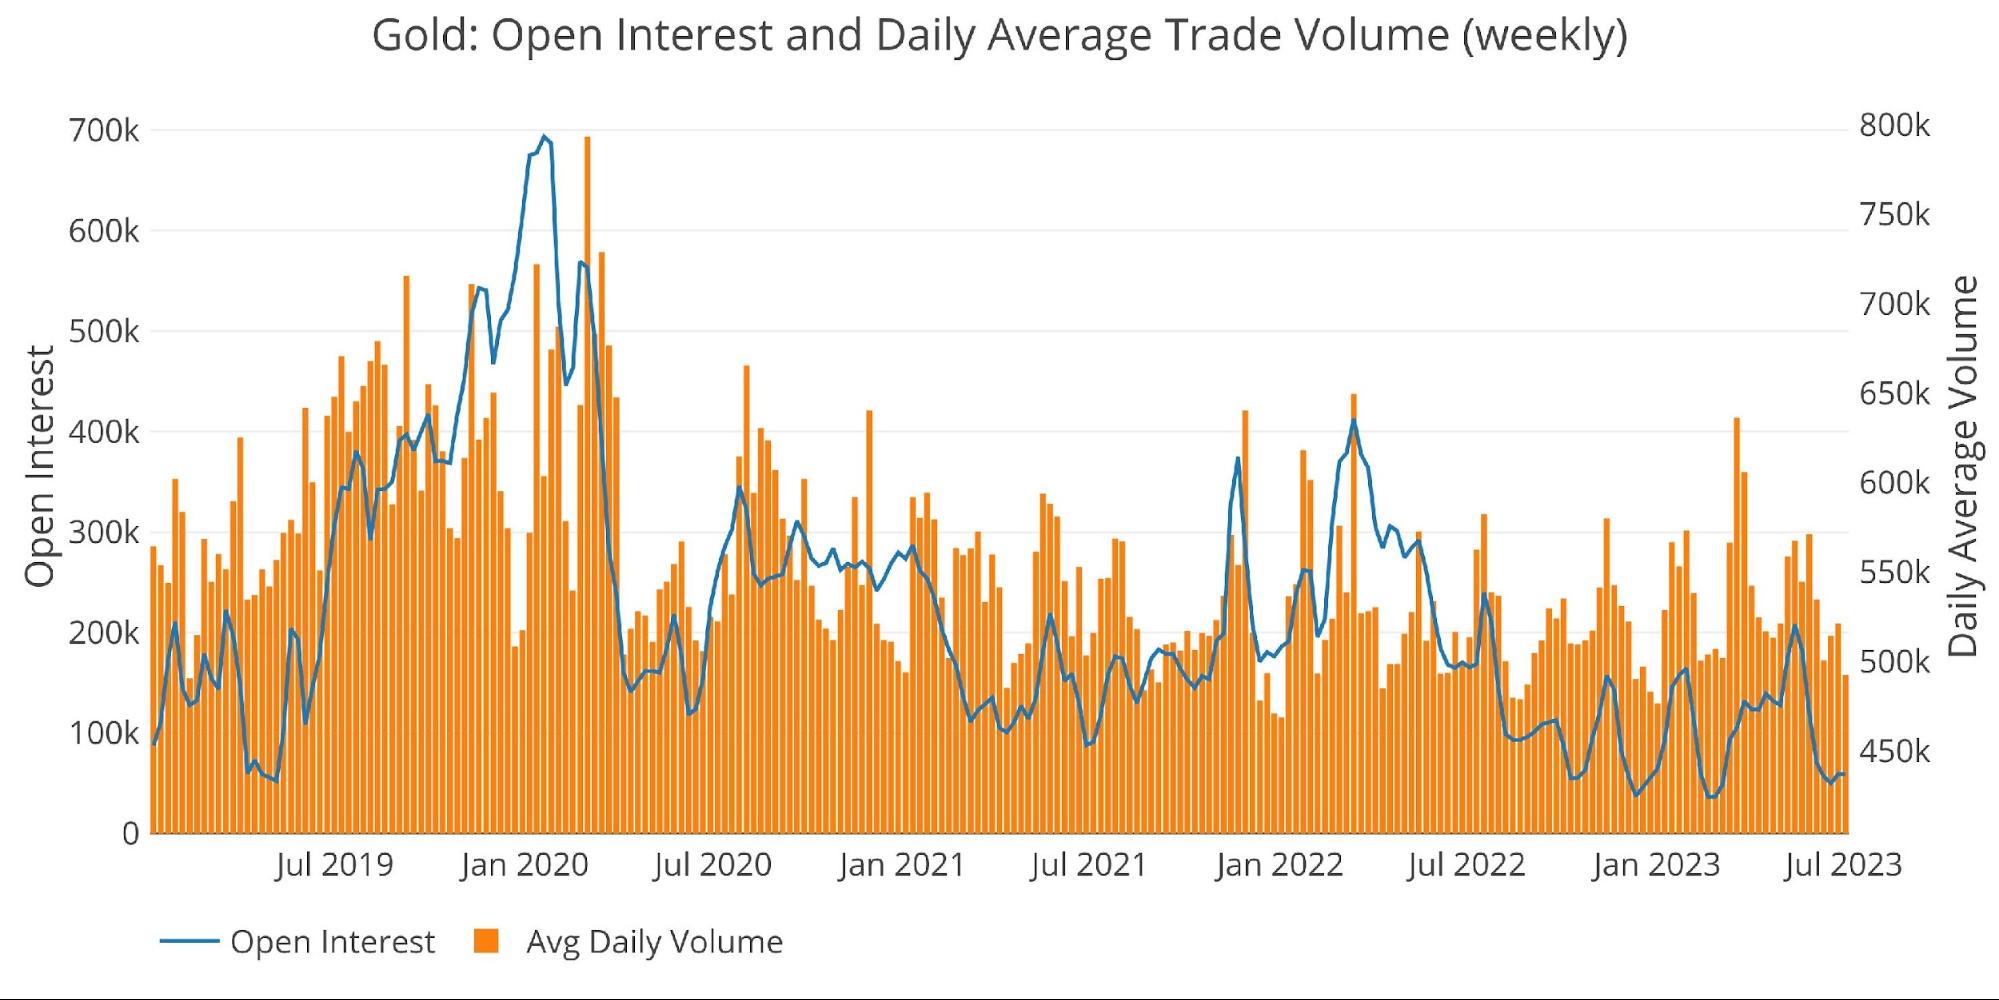
Figure: 10 Gold Volume and Open Interest
Silver saw a significant volume spike last week. Given the price action, this was likely longs bailing or shorts adding. In either case, this could create an even larger pullback when the volume recedes.
Outlook: Bearish
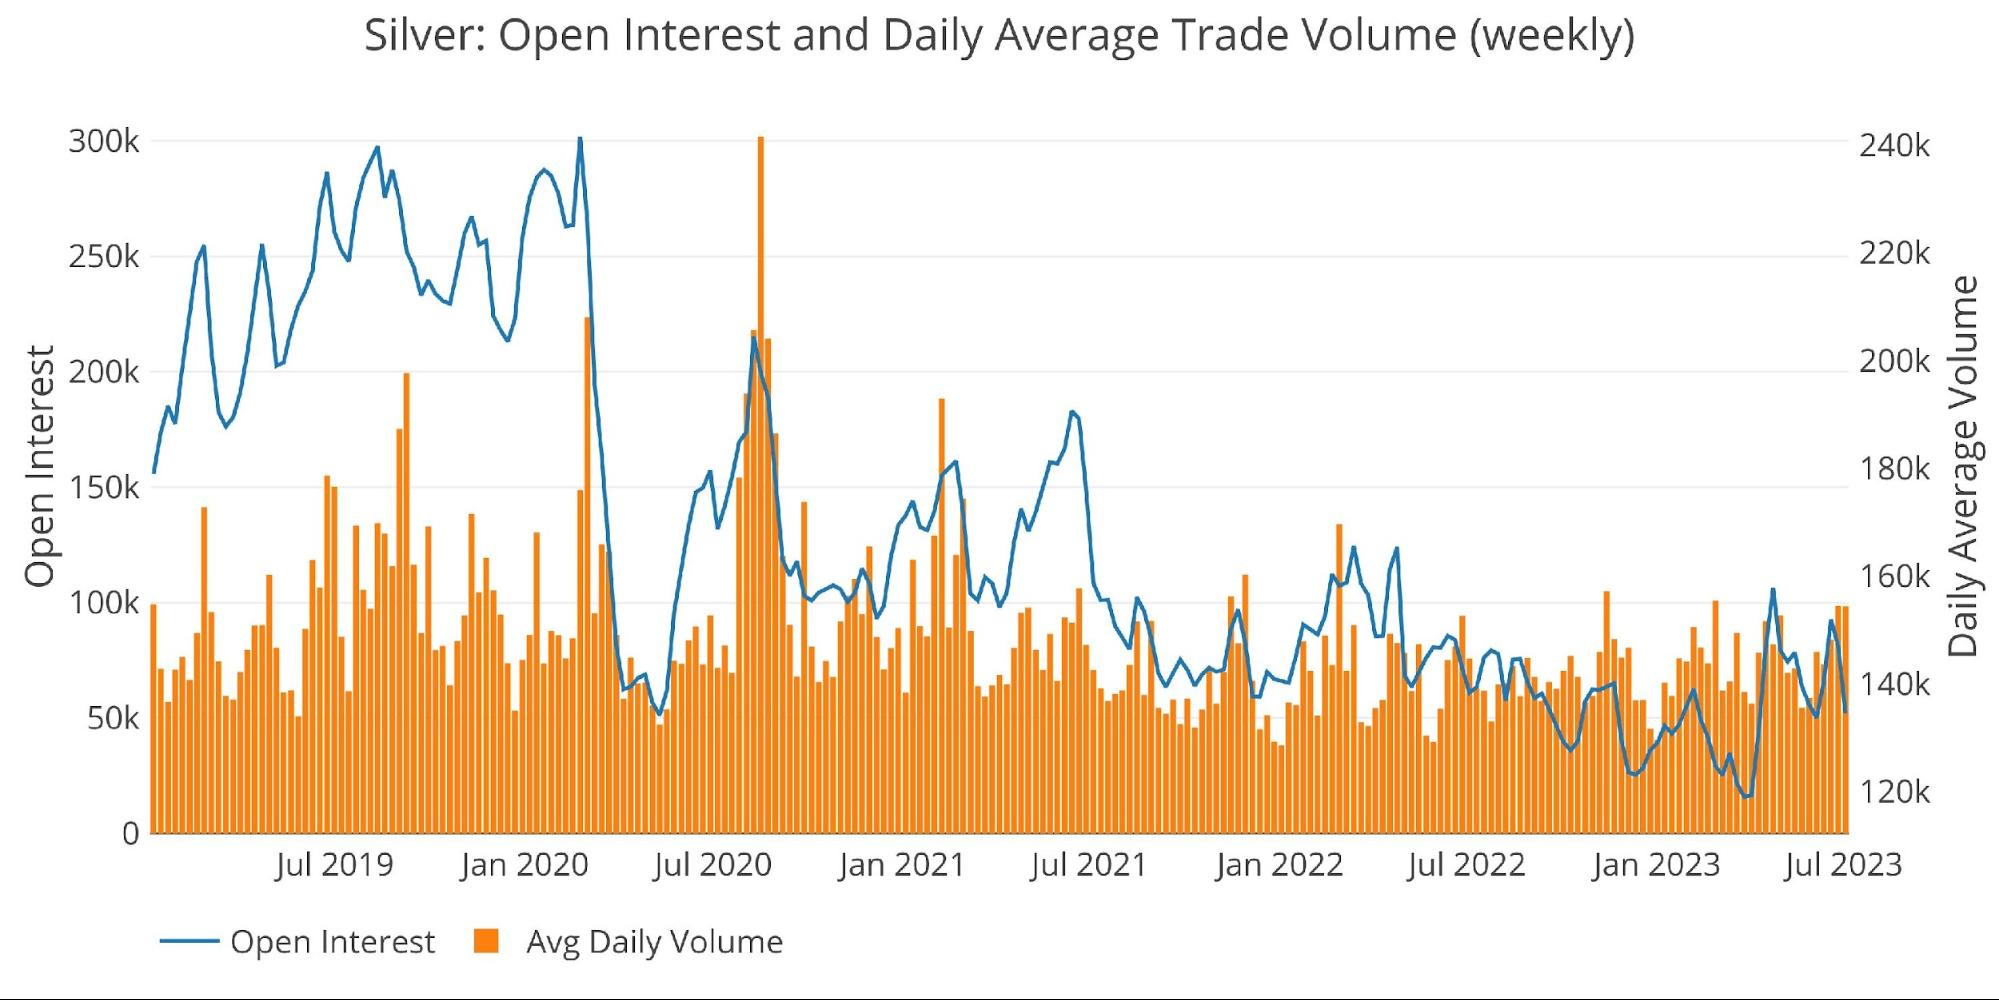
Figure: 11 Silver Volume and Open Interest
Other drivers
USD and Treasuries
Price action can be driven by activity in the Treasury market or US Dollar exchange rate. A big move up in gold will often occur simultaneously with a move down in US debt rates (a move up in Treasury prices) or a move down in the dollar.
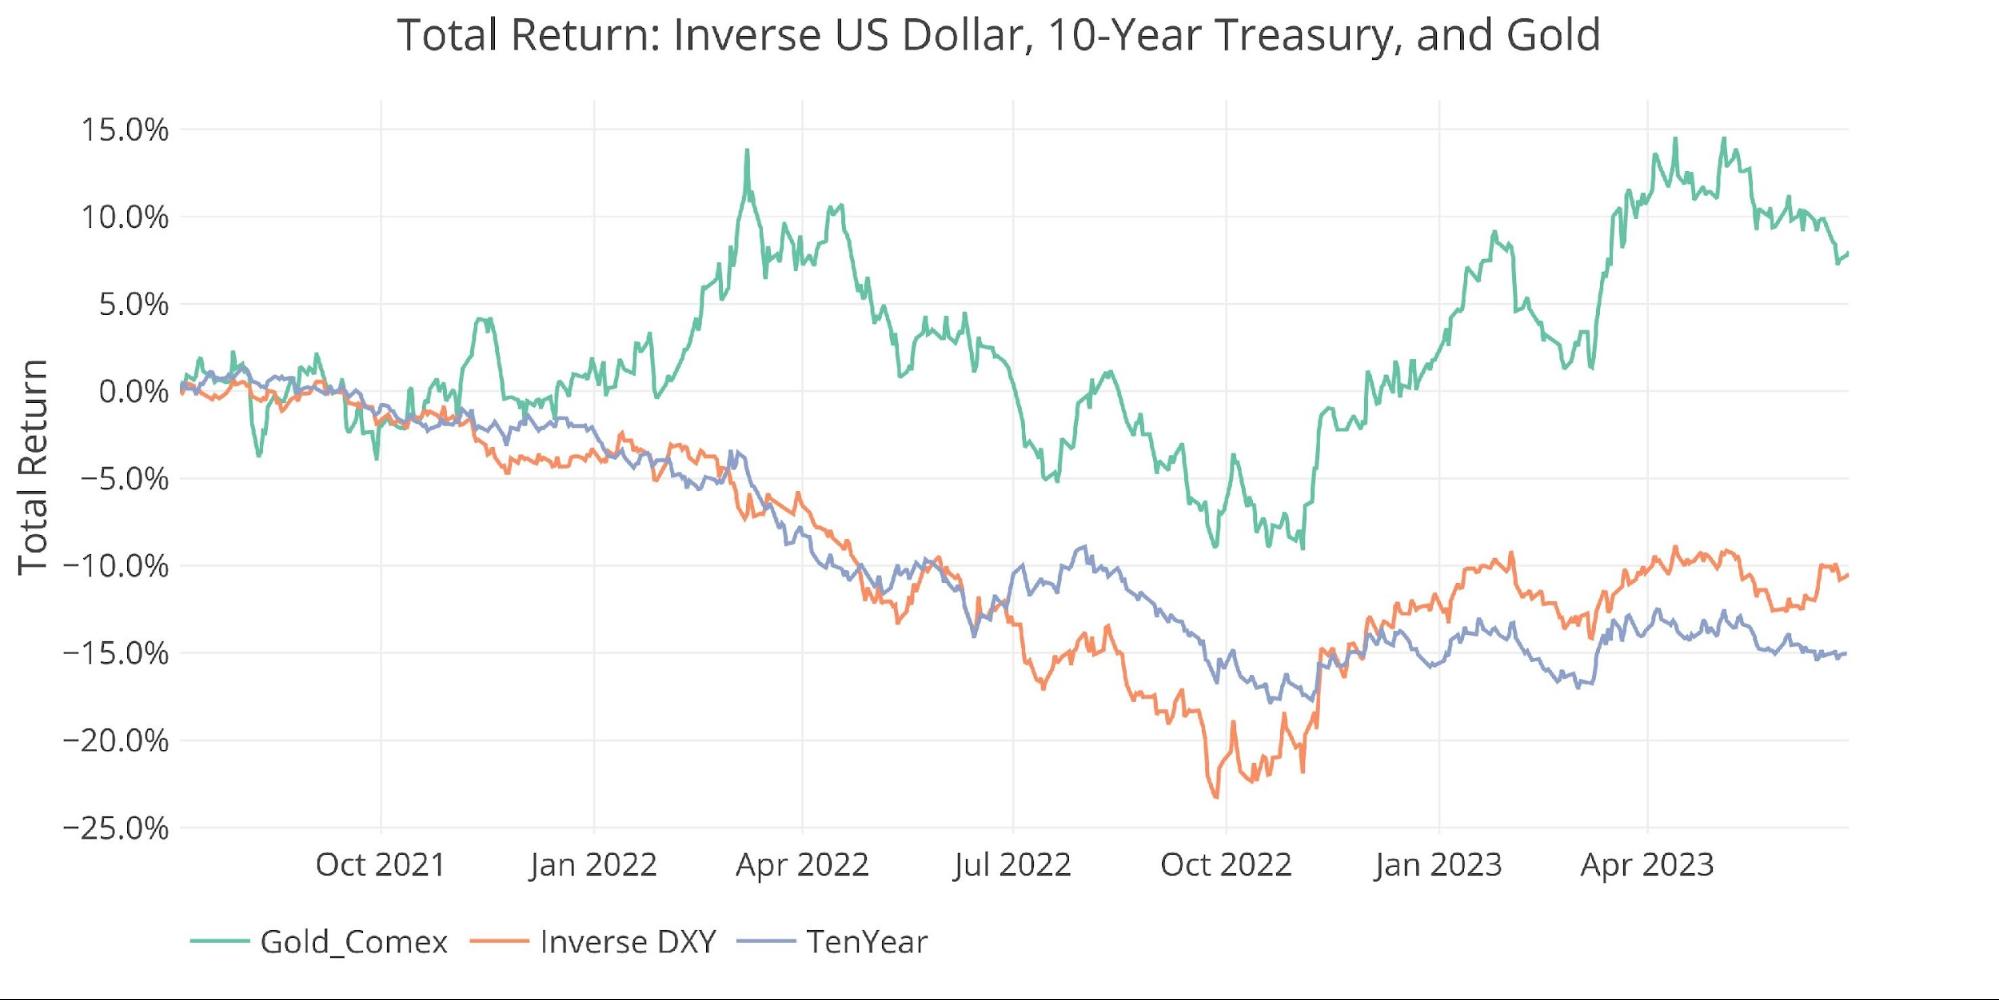
Figure: 12 Price Compare Inverse DXY, GLD, 10-year prices
Gold fell last week despite the dollar also falling and bonds staying mostly flat. This is uncharacteristic and usually means a reversion of some kind. It’s always better to trust the larger market which is the currency and bond market in this case. The chart suggests that the down move in gold last week was unwarranted which may lead to a turnaround this week.
Outlook: Bullish
Gold Silver Ratio
The gold-silver ratio has turned back up going over 80. This is on the high end of the range.
Outlook: Silver bullish relative to gold long-term
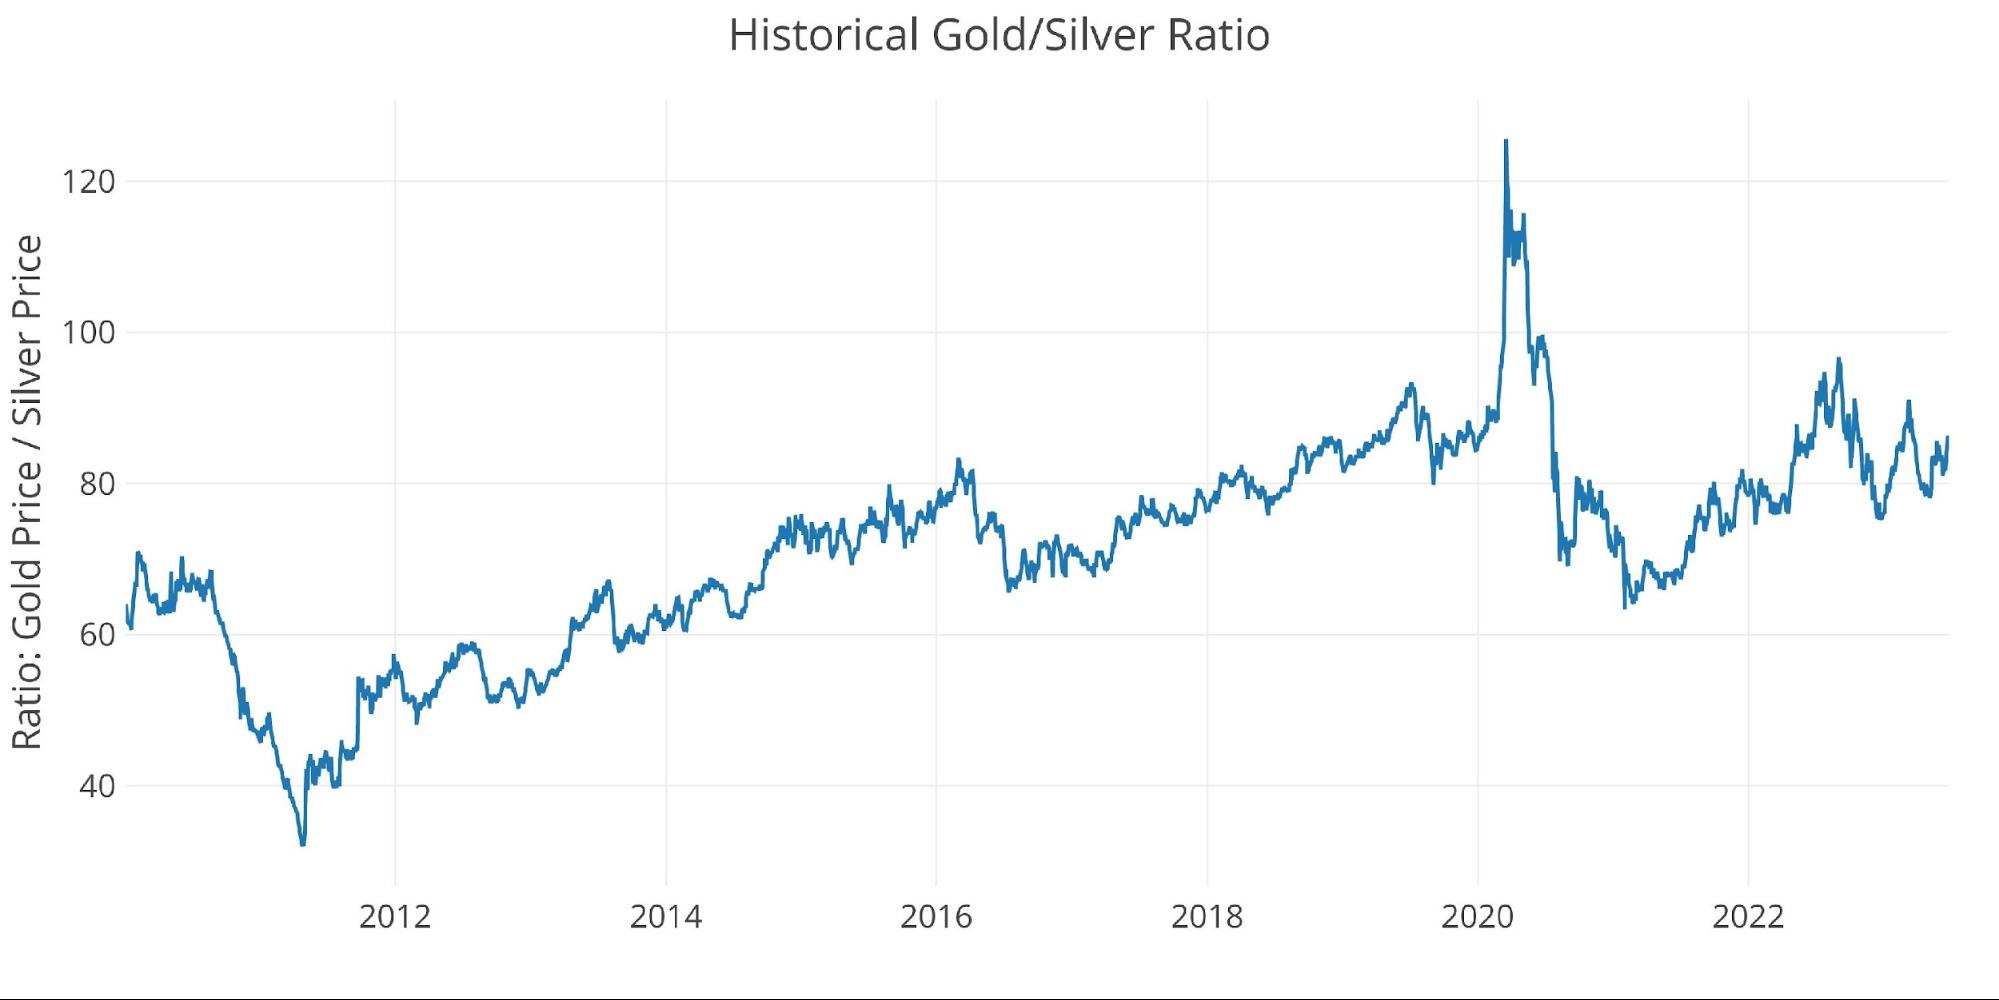
Figure: 13 Gold Silver Ratio
Bringing it all together
The table below shows a snapshot of the trends that exist in the plots above. It compares current values to one month, one year, and three years ago. It also looks at the 50 and 200-daily moving averages. While DMAs are typically only calculated for prices, the DMA on the other variables can show where the current values stand compared to recent history.
-
- The divergence in gold and silver is clear to see below. Over the last month, both prices have fallen, but gold has seen all the other variables also decline while silver has seen an increase.
- The 50 DMA change is similar with gold seeing drops across the board against a mixed picture in silver
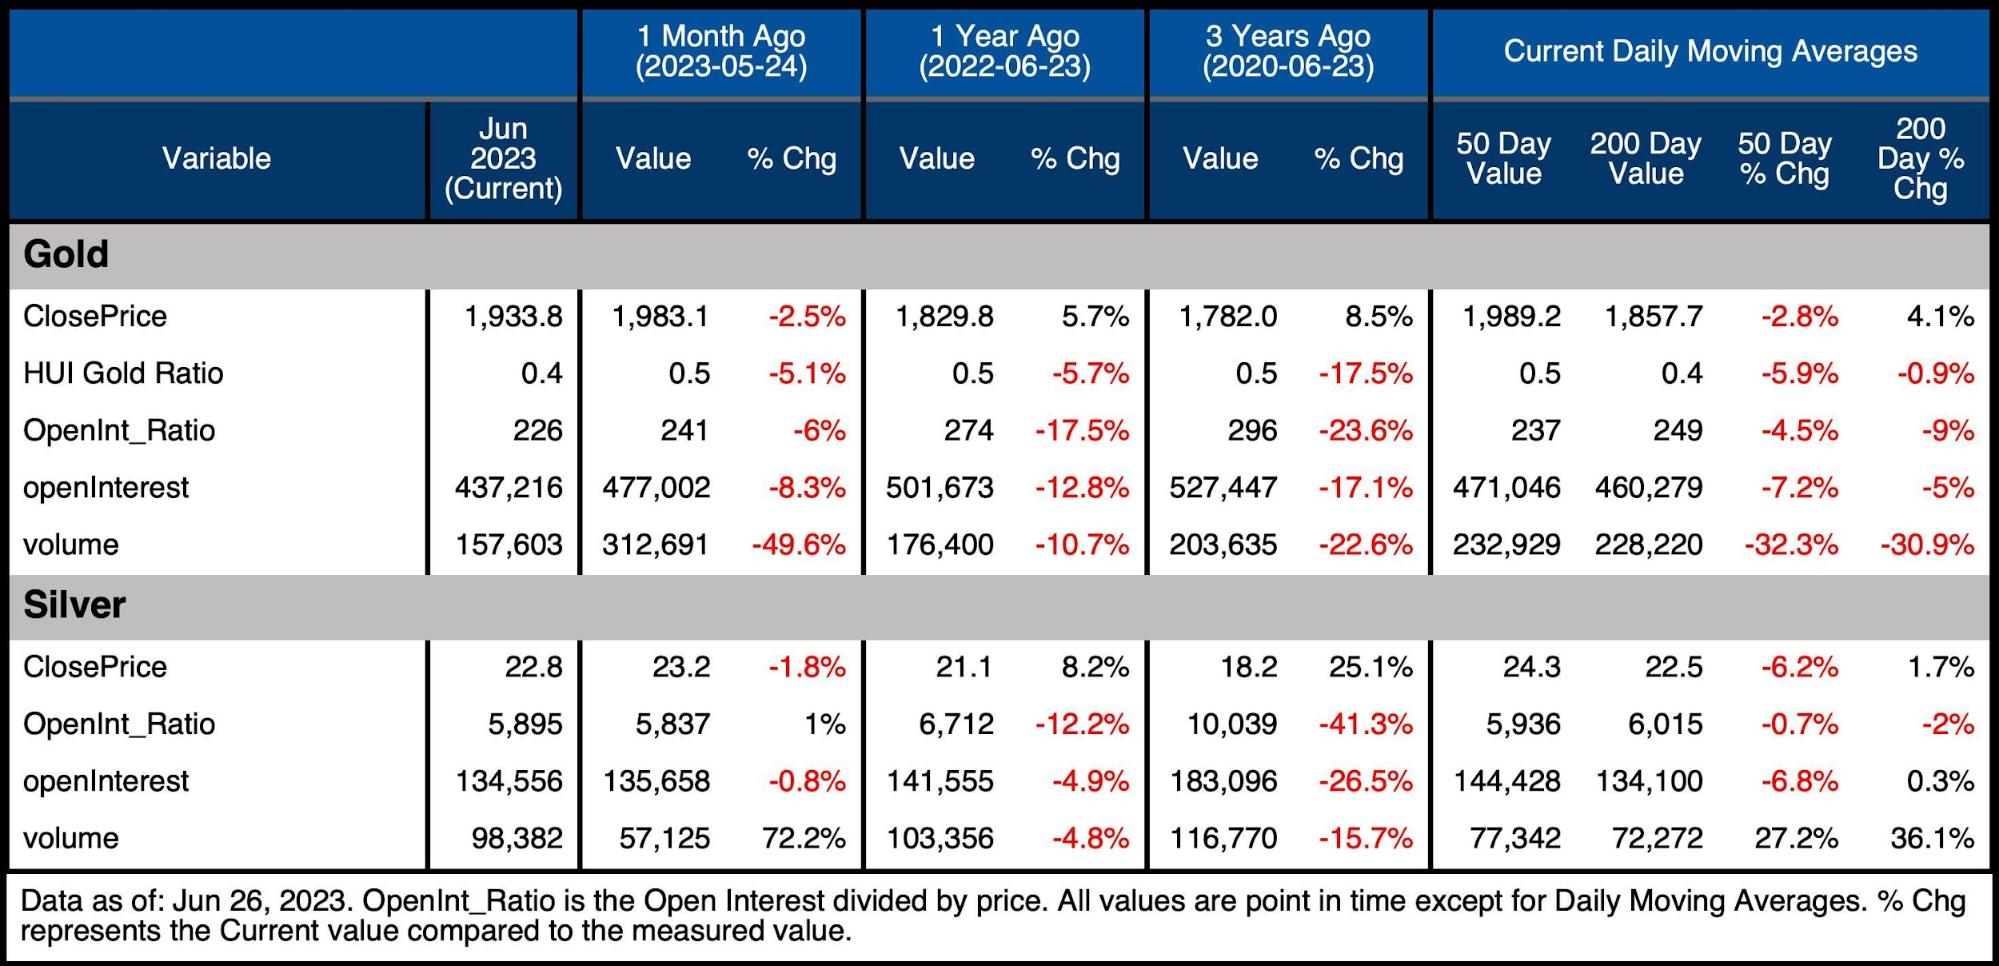
Figure: 14 Summary Table
Wrapping up
While gold and silver generally move in tandem, the setup in the two metals is very different right now. Gold has a lot of data points suggesting the correction is very close to ending (if it hasn’t already). Silver looks like it still has more room to the downside.
This could be because silver is a dual-purpose metal while gold is mostly a monetary metal. Silver may get held back by further data points confirming economic weakness while gold would have a clear path higher with the data sidelining a hawkish Fed.
The downside in gold looks limited. A test to $1880 isn’t impossible but the right spark will likely take gold well past $2000. Thus, the potential is to the upside. Silver will likely follow, but it might be a bit choppier. A turnaround isn’t clearly imminent without a catalyst, but that catalyst could also occur at any time.
Data Source: https://www.cmegroup.com/ and fmpcloud.io for DXY index data
Data Updated: Nightly around 11 PM Eastern
Last Updated: Jun 26, 2023
Gold and Silver interactive charts and graphs can be found on the Exploring Finance dashboard: https://exploringfinance.shinyapps.io/goldsilver/

Call 1-888-GOLD-160 and speak with a Precious Metals Specialist today!
Buka akaun dagangan patuh syariah anda di Weltrade.
Source link