The path of the least resistance for the coin is lower, with the next key support being at 40,000.
Bearish View
- Sell the BTC/USD pair and set a take-profit at 40,000.
- Add a stop-loss at 45,000.
- Timeline: 1-2 days.
Bullish View
- Set a buy-stop at 44,000 and a take-profit at 46,000.
- Add a stop-loss at 40,000.
The BTC/USD pair remained under pressure even as the closely watched North American Bitcoin Conference kicked off in Miami. Bitcoin is trading at $42,200, which is substantially lower than the all-time high of over $68,000.

Bitcoin Rebound Fizzles
The BTC/USD pair declined sharply and crossed the important support level at 40,000. The sell-off was a continuation of the decline that started a few months ago when Bitcoin jumped to an all-time high of over 68,000.
Analysts cite the performance of Bitcoin to profit-taking among investors who had spectacular returns in 2021. Also, historically, Bitcoin tends to decline before it nears a key resistance level.
Another reason for the recent sell-off is the fact that investors are afraid about monetary policy. Recently, the Federal Reserve and other central banks have signaled that they will hike interest rates this year. The Fed has already hinted that it will implement 3 or more rate hikes this year.
Therefore, the concern among investors is that since Bitcoin rallied amid a low-interest rate environment, the path of the least resistance will be lower when the policy changes.
Another concern is that many big institutional investors have stayed in the sidelines recently. Indeed, most American investors have not invested in Bitcoin despite their bullish statement about the coin. Most investors cite the fact that Bitcoin is a highly volatile coin and the fact that there is no clarity about regulations.
The regulatory picture will likely become clearer in the next few weeks. In testimony to Congress, Jerome Powell said that the Federal Reserve’s report will be out in the next few weeks. This report could help to build confidence among investors.
Meanwhile, the BTC/USD pair moved sideways during the North America conference. This performance was mostly because there were no notable statements from leading investors about the coin.
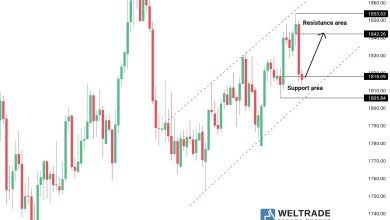
BTC/USD Forecast
The daily chart shows that the BTC/USD pair has been under pressure in the past few months.The sell-off accelerated after the coin managed to move below the key support level at 56,670, which was the lowest level on October 27th.
It has moved below the 25-day and 50-day moving averages while the MACD has moved below the neutral level. Therefore, the path of the least resistance for the coin is lower, with the next key support being at 40,000.

Source link