Euro, EUR/USD, US Dollar, Crude Oil, JPY, ECB, Lagarde, Fed, Powell – Talking Points
- The Euro has been climbing off a 2-year low as the ECB scopes inflation
- APAC equities went south while commodities had a mixed day in Asia
- All eyes on ECB and Fed leaders today.Can EUR/USD continue higher?
The Euro was steady against the US Dollar in Asia today ahead of comments from ECB President Christine Lagarde and Federal Reserve Chair Jerome Powell.
It is expected that President Lagarde will follow up on her remarks from last week where she highlighted the flexibility of the central bank to address inflationary pressures as they emerge. Those comments were a reference to the impact of Russia’s war in Ukraine.
Fed Chair Powell will be presenting at the NABE economic policy conference, and he will be speaking after Atlanta Fed President Raphael Bostic.
The Japanese Yen made another 6-year low against the US Dollar on Friday and has remained near that level today.
A positive finish to the week on Wall Street failed to give broader APAC equities a boost on Monday.
Australia’s ASX 200 was flat, while Chinese and Hong Kong bourses were lower on the day. Japanese markets were closed for a holiday. Futures are pointing a soft start to the US session.
Alumina nudged higher after Australia announced that they would ban exports to Russia. Most other commodity markets were fairly quiet, except for the energy sector.
WTI crude is back above US$ 108 bbl after closing at US$ 103.09 bblon Friday. It’s being reported that Houthi rebels had again attacked Saudi Arabian oil infrastructure.
Elsewhere, Beijing says it will do all it can to de-escalate the Ukraine war but did not condemn Russia. The PBOC left their medium-term lending rates unchanged.
The full economic calendar can be viewed here.
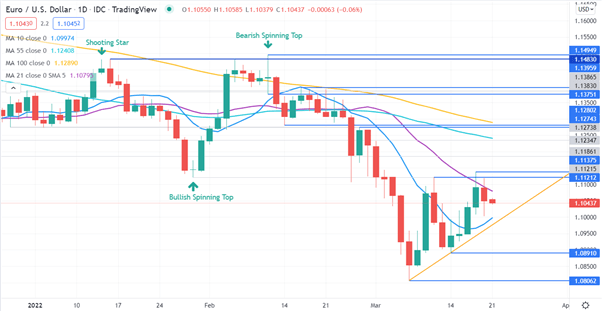
EUR/USD Technical Analysis
EUR/USD is trying to rally off the 2-year low seen earlier this month and has broken up through the 10-day simple moving average (SMA) but it remains below the 55 and 100-day SMAs.
This may suggest that short-term bullish momentum is running up against medium- and long-term bearishness. The 55 and 100-day SMAs are straddling potential resistance at 1.12743 and 1.12802.
A break above these levels could suggest a unfolding bullish momentum, while an inability to trade above there, may indicate underlying bearishness is continuing to dominate.
Nearby resistance might be at the recent peaks of 1.11212 and 1.11375.
On the downside, support may lie at the recent lows of 1.08910 and 1.08062. An ascending trend line may also provide support, currently intersecting at 1.0980.
— Written by Daniel McCarthy, Strategist for DailyFX.com
To contact Daniel, use the comments section below or @DanMcCathyFX on Twitter
Buka akaun dagangan patuh syariah anda di Weltrade.
Source link