\The February Trade Deficit increased for the third month in a row, rising by $1.9B. Net Goods came in at -$92.9B with Net Services at $22.4B to reach a total of -$70.5B.

Figure: 1 Monthly Plot Detail
The table below provides detail.
Monthly Trade Deficit
-
- Goods Imports and Exports both fell
-
- Exports fell by a greater margin than Imports driving the Goods Deficit up by 3% or $2.7B
-
- Services Imports and Exports both increased
-
- Exports increased by a greater margin than Imports driving the Services Surplus up by 3.9% or $800M
-
- Goods Imports and Exports both fell
Looking at Trailing Twelve Month:
-
- Exports and Imports in Goods have grown significantly over the last year, with Exports increasing beyond $2.1T and Imports increasing to over $3.2T
-
- With Exports increasing faster than Imports the TTM Goods Deficit was up 2.7% to $1.16T
-
- The Services Surplus saw a similar pattern with increases in both Imports and Exports
-
- Exports increased faster causing the Services Surplus to rise by 4.6%
-
- The TTM Deficit fell to -$909B after reaching close to -$975B last summer. It is still up YoY by 2.2%.
-
- Total Exports has exceeded $3T with total Imports closing in on $4T
-
- Exports and Imports in Goods have grown significantly over the last year, with Exports increasing beyond $2.1T and Imports increasing to over $3.2T
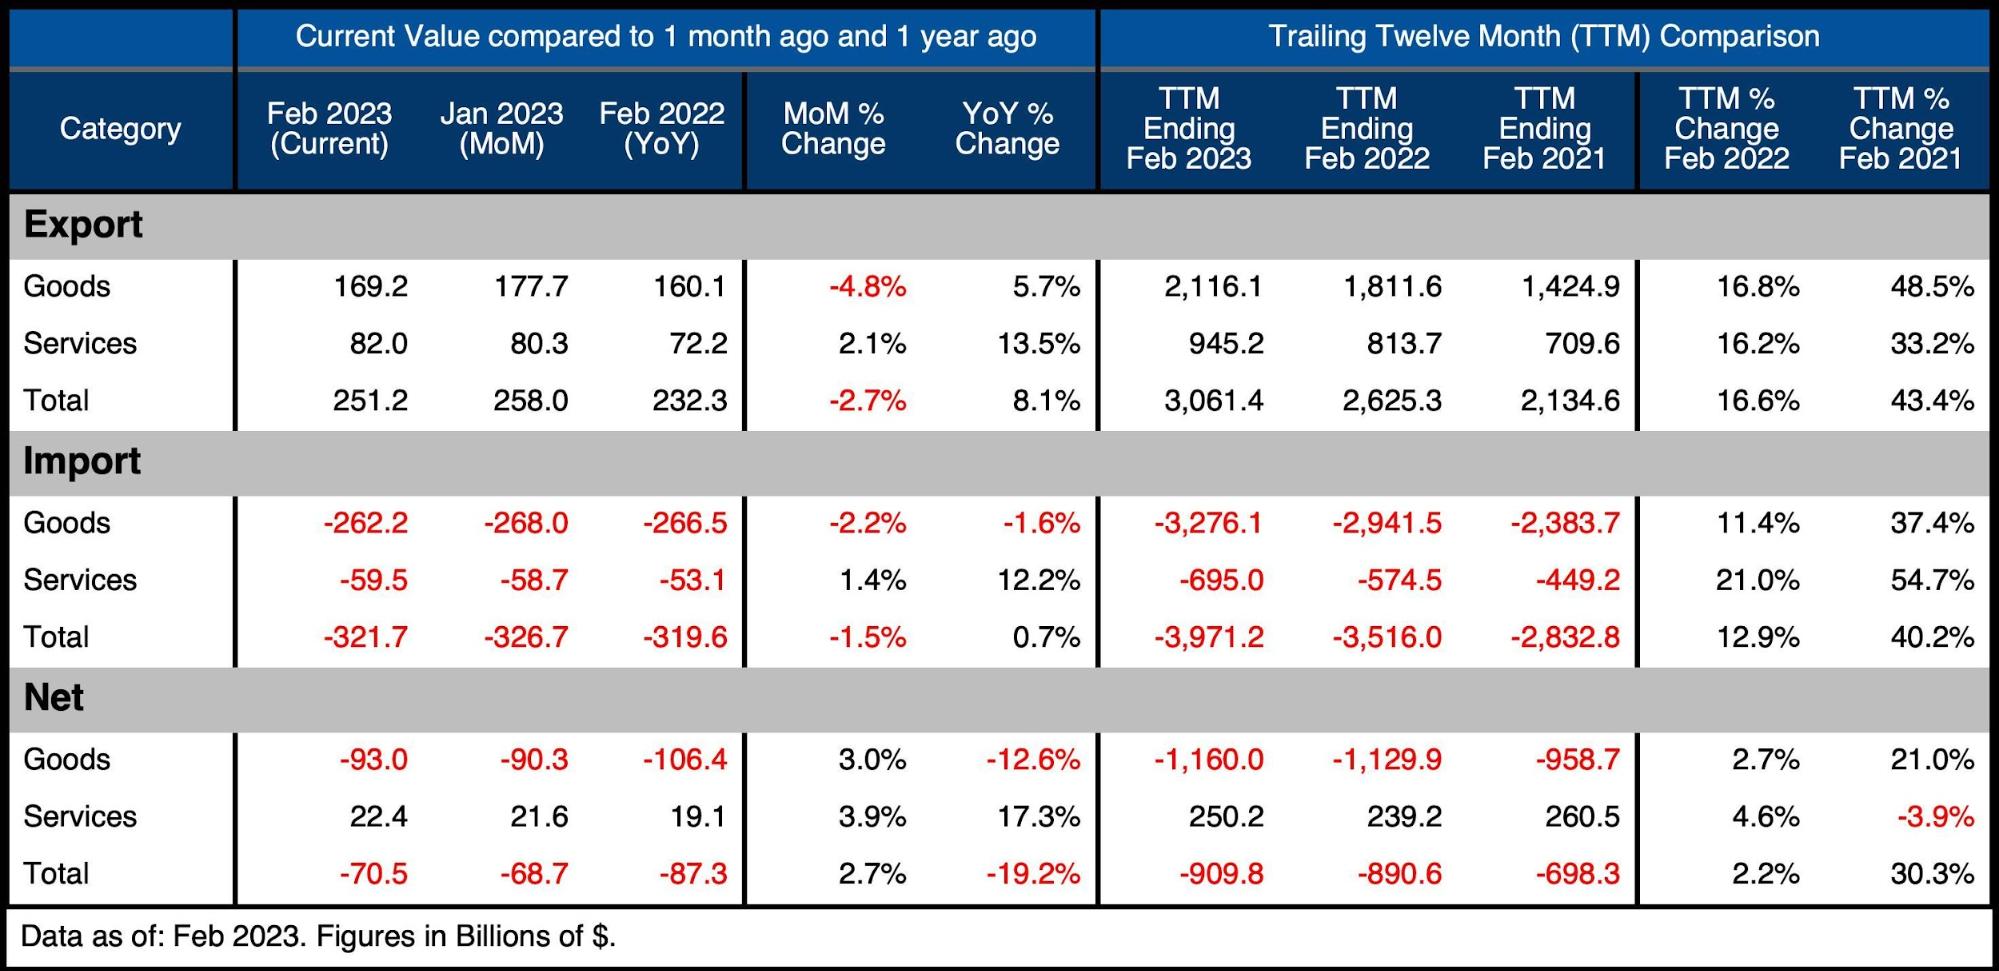
Figure: 2 Trade Balance Detail
Historical Perspective
Zooming out and focusing on the net numbers shows the longer-term trend. We are well off the lows seen last March, but the volatility has increased dramatically. The Trade Deficit looks to be trending back down after a brief recovery topped out in November last year when the Deficit almost fell below $60B.

Figure: 3 Historical Net Trade Balance
The Services Surplus saw a slight uptick this month. The chart below shows that Net Services continue to fall as a percentage of total Exported Services. The February number was 27.4%, down from the 35% average seen pre-Covid. The current value is off the lows seen in mid-2022 but does not appear to have broken the downward trend.
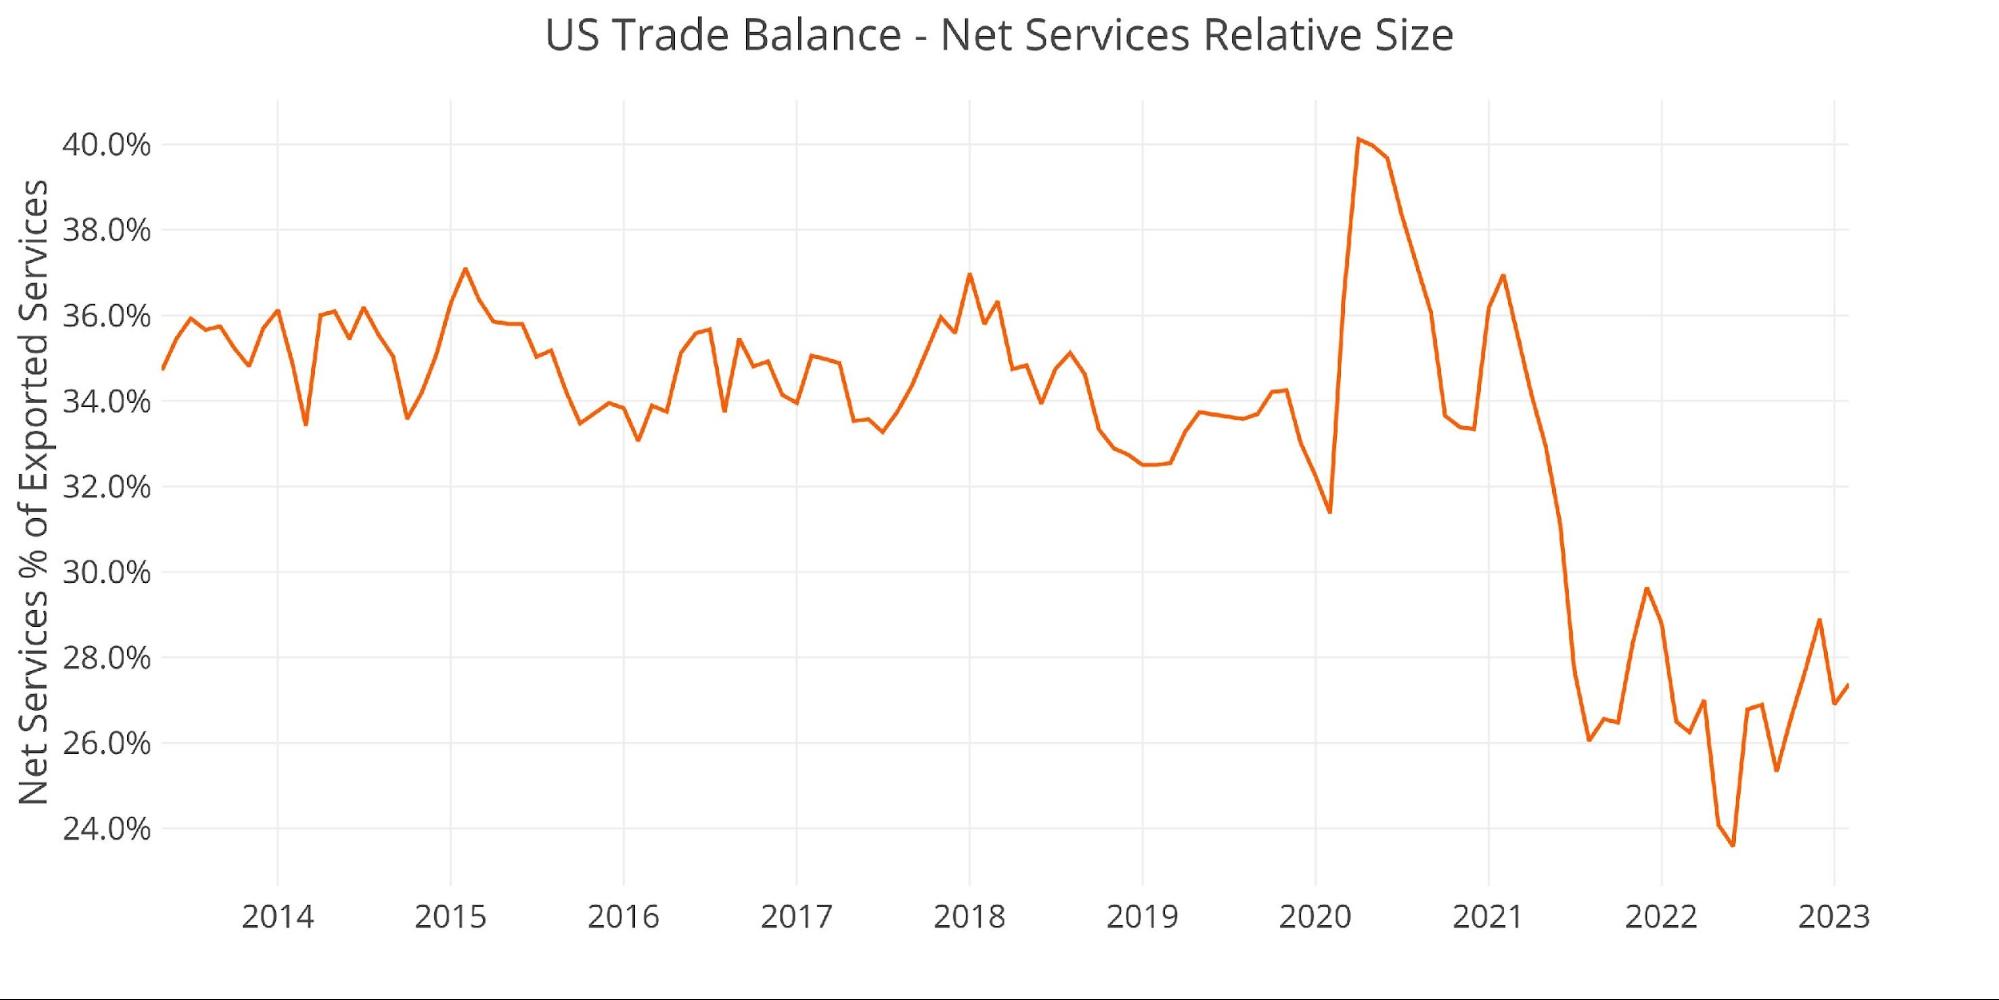
Figure: 4 Historical Services Surplus
To put it all together and remove some of the noise, the next plot below shows the Trailing Twelve Month (TTM) values for each month (i.e., each period represents the summation of the previous 12-months). The global surge in consumption post-Covid is clear to see below, or, more likely, the global increase in prices. The black line is showing a mild recovery on a TTM basis driven by a slight decrease in Net Goods Deficit and a slight increase in Net Services Surplus in recent months.
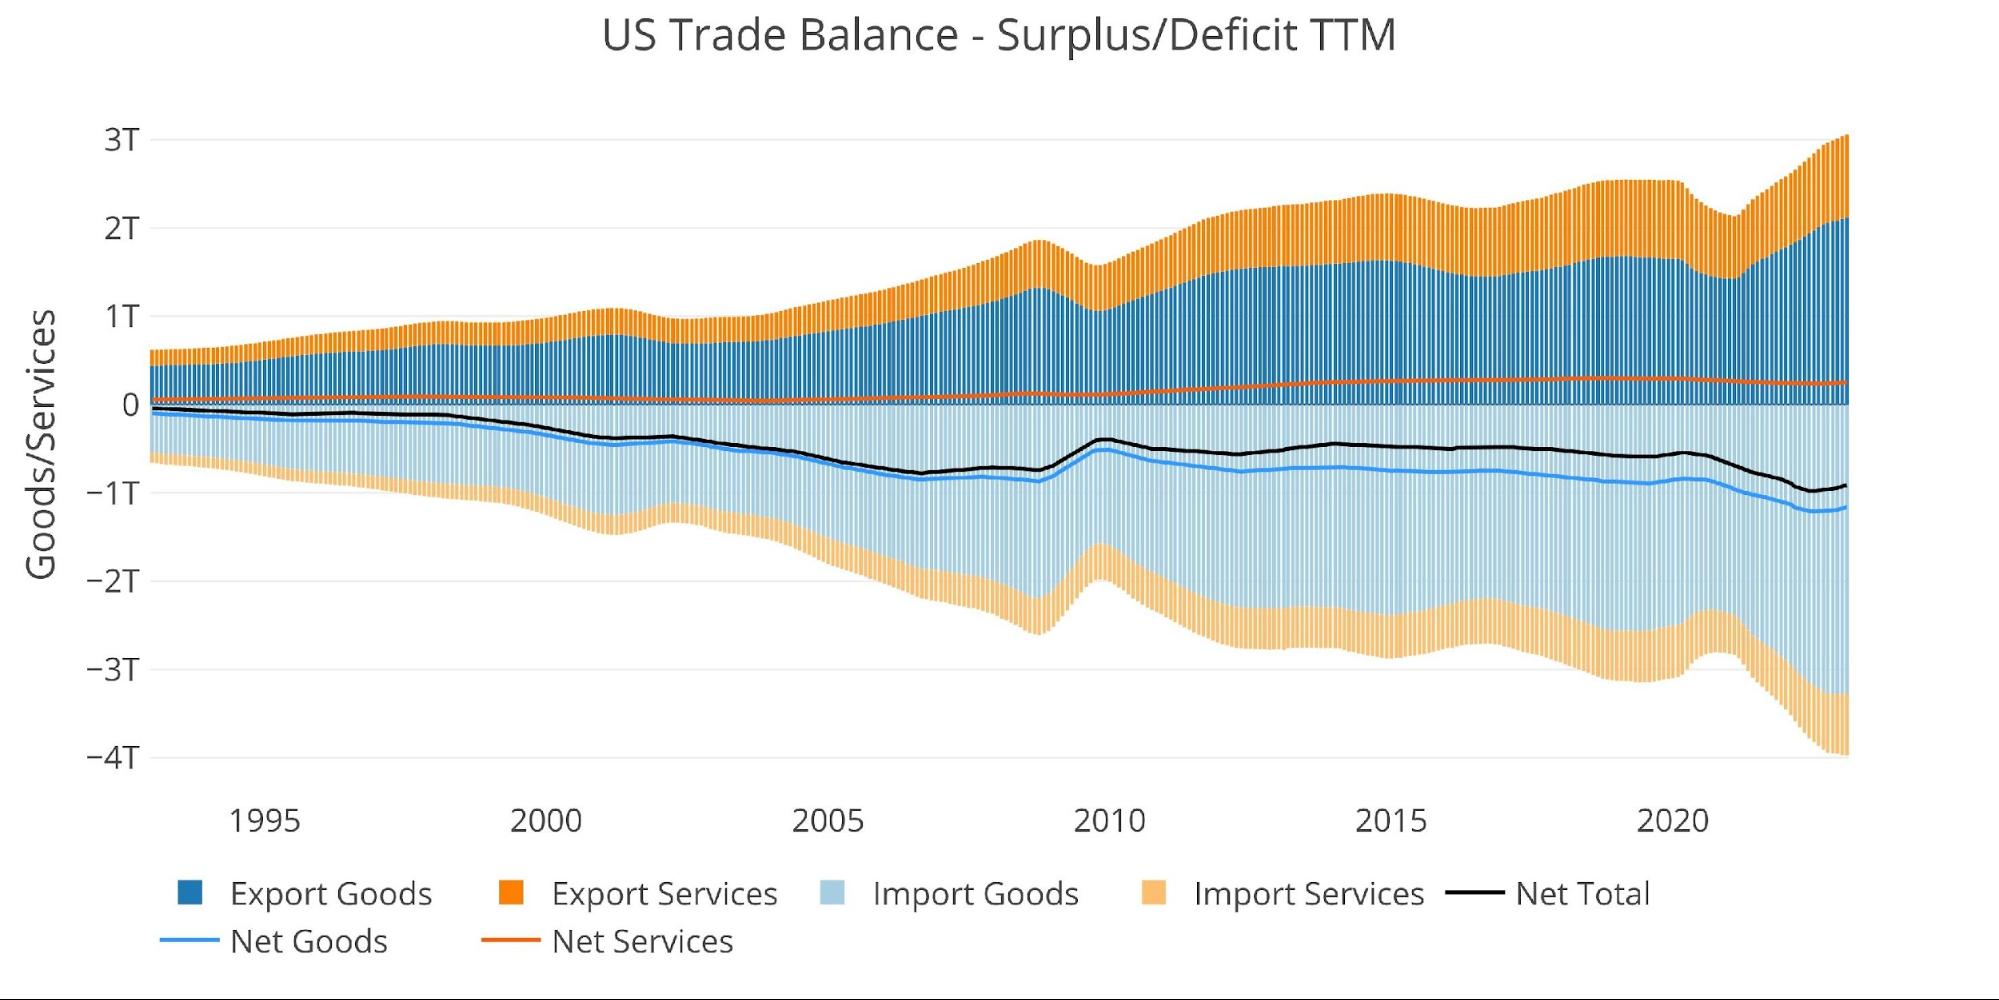
Figure: 5 Trailing 12 Months (TTM)
Although the TTM Net Trade Deficit is near historical highs, it can be put in perspective by comparing the value to US GDP. As the chart below shows, the current records are still below the 2006 highs before the Great Financial Crisis.
The current value of 3.48% is moving back down but is still well above the 2.5% from before Covid.
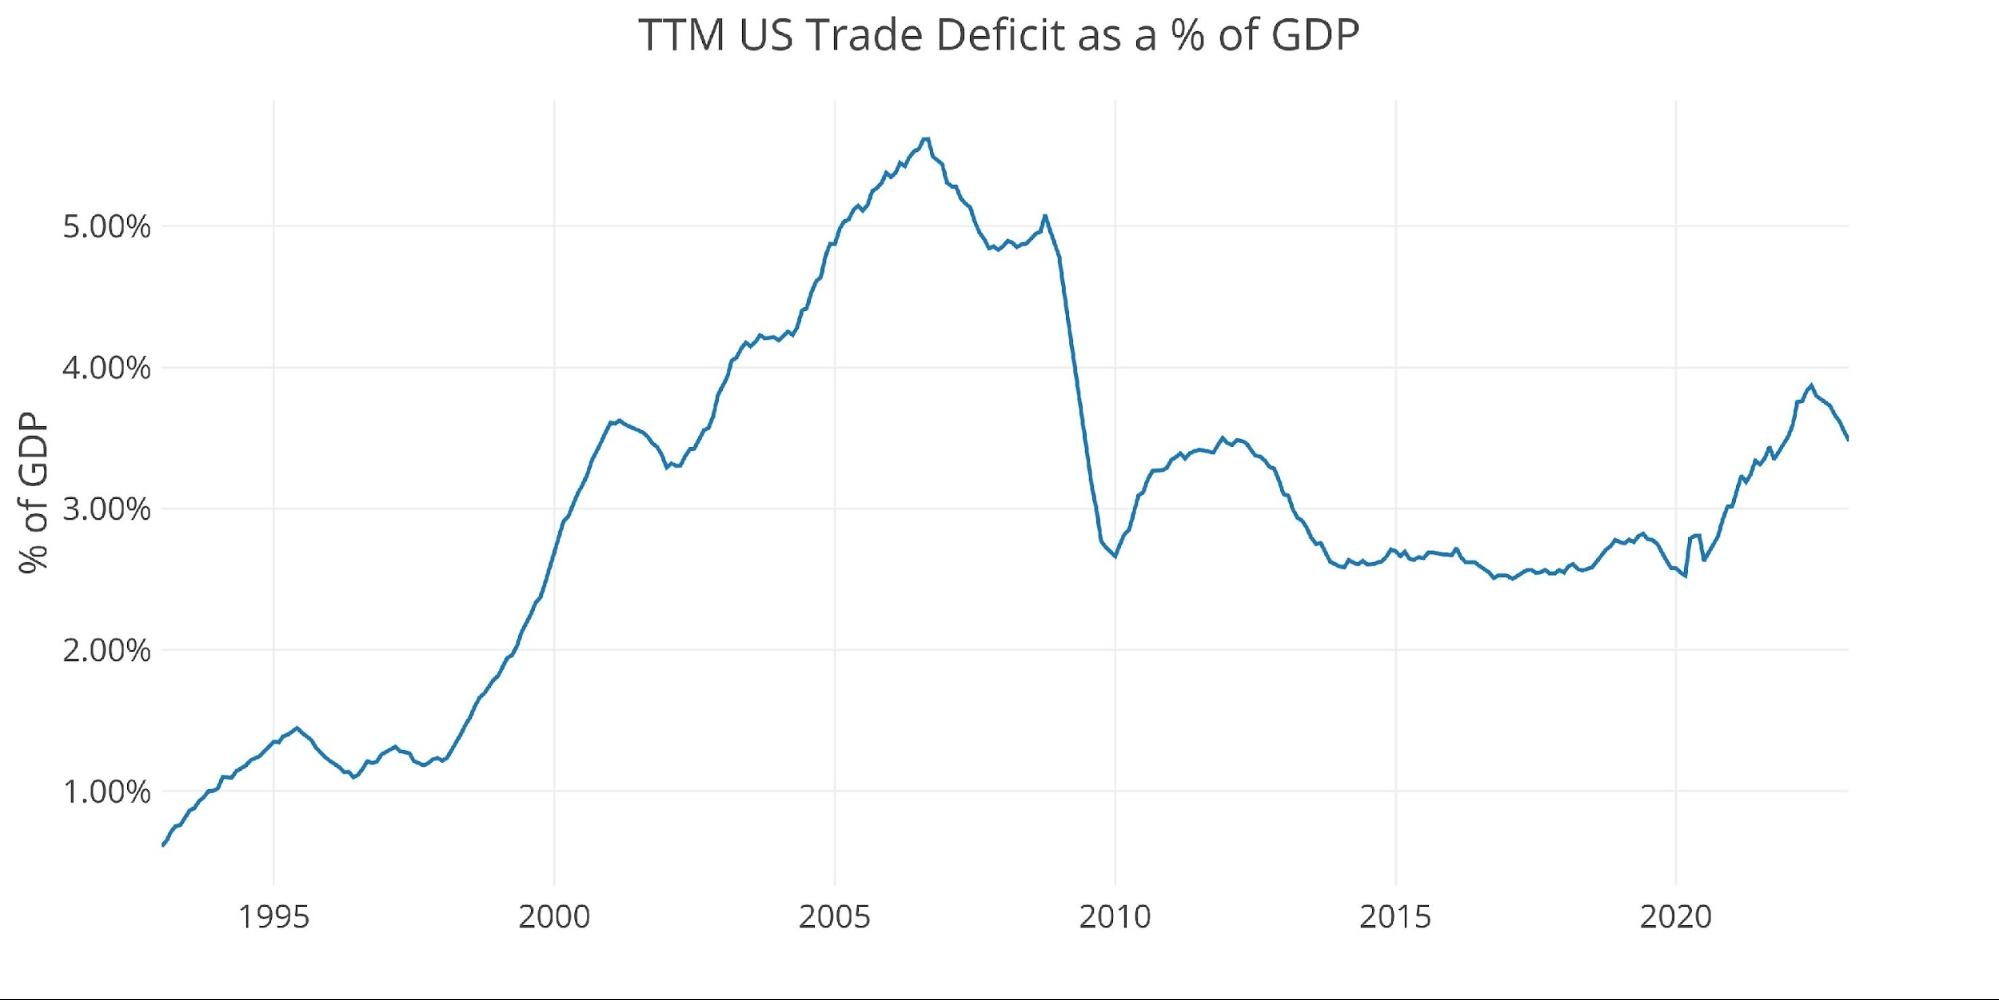
Figure: 6 TTM vs GDP
The chart below shows the YTD values. Because the latest month is February, this only shows two months. It is clear to see how this year is larger in all categories compared to last year and also how Exports have grown more than Imports.
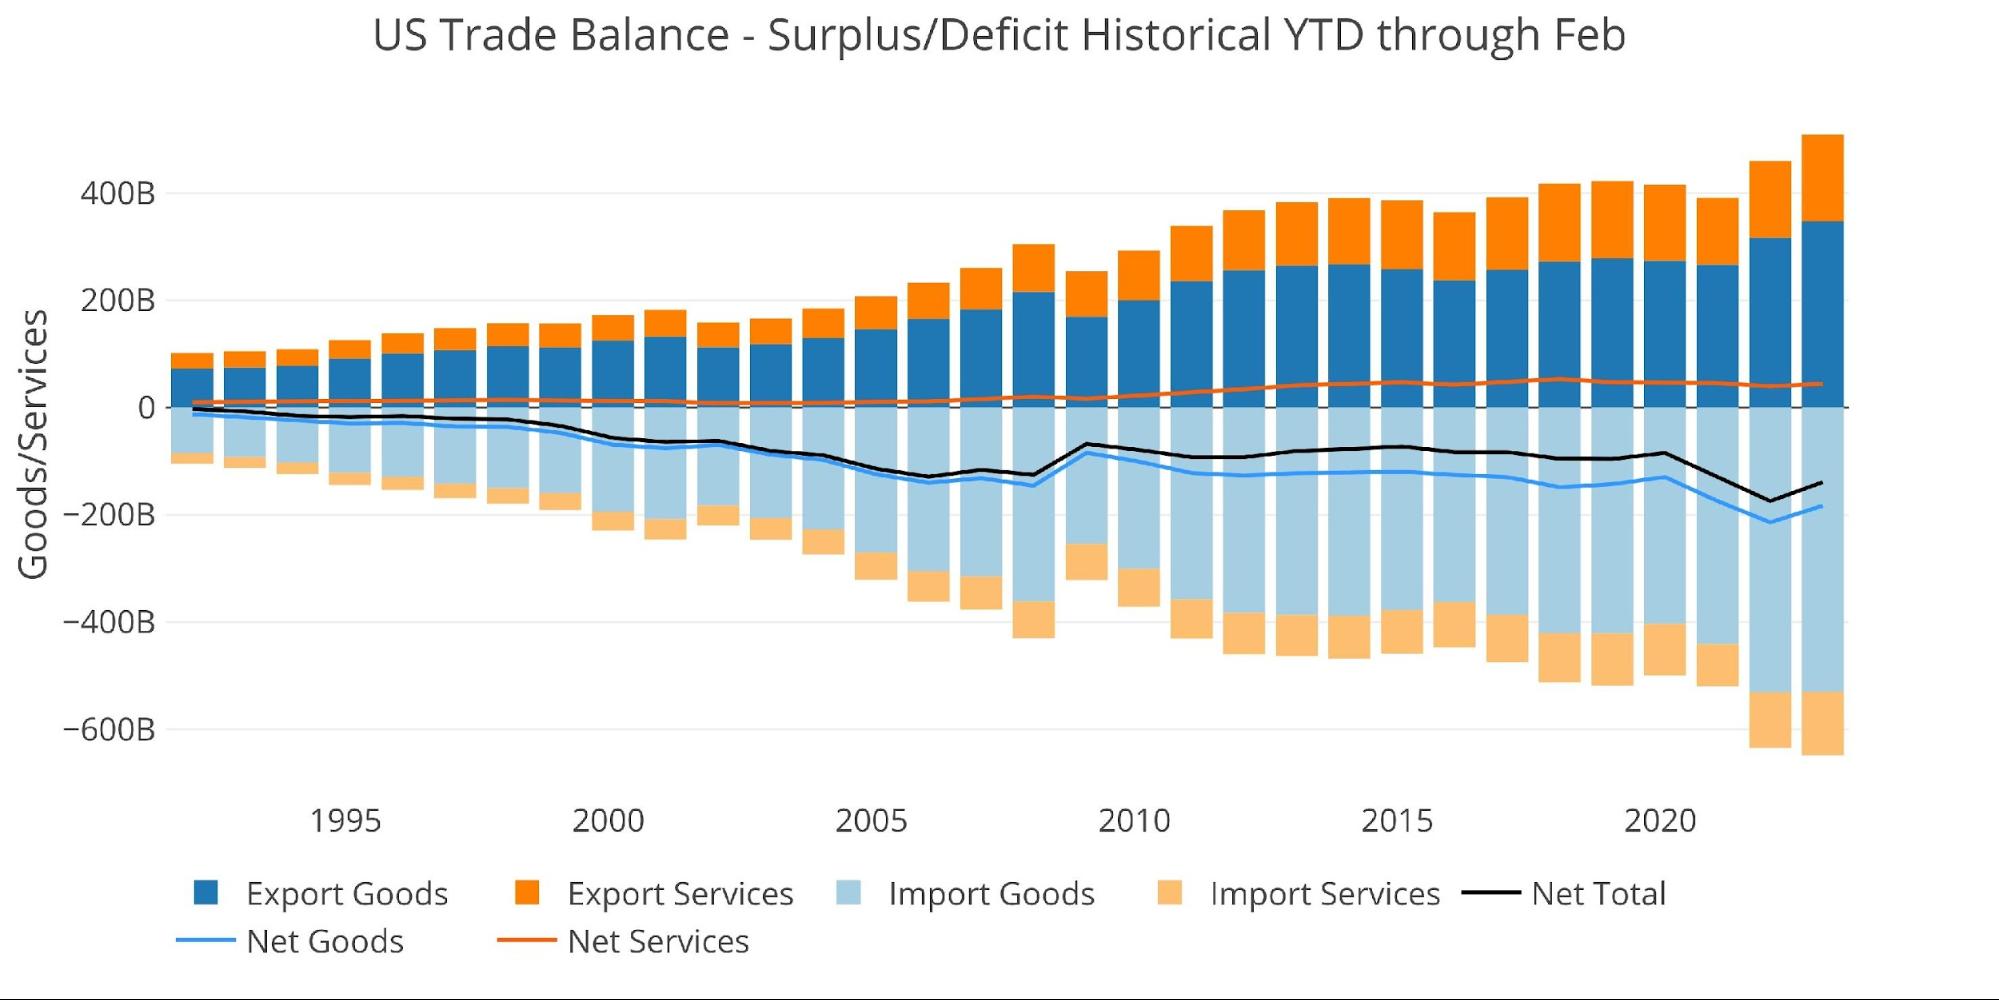
Figure: 7 Year to Date
Wrapping Up
The Trade Deficit is down from the records set last year, but the US is still printing very large Deficits. This means the US is still flooding the world with dollars in exchange for goods. This is a very dangerous situation for the US, especially as more signs point to a move away from the USD. The BRICS are working on a new currency in a very specific attempt to de-Dollarize.
This could be extremely problematic. For decades, the US has benefited by having the world reserve currency. This has allowed Americans to live way beyond their means, trading paper currency for physical goods abroad. The foundation for massive inflation has now been laid. If the USD loses its dominance and global demand for dollars falls, all those dollars are going to come rushing back to the US. The Fed will not be in a position to then reduce the amount of dollars bidding up goods and services domestically.
Further exacerbating the problem is that the US has grown comfortable with cheap imported goods as the Trade Deficit shows. If the world starts turning away from the dollar, those foreign goods will be harder to obtain at current prices. Thus, you have a double impact on inflation: more dollars in the US chasing up goods and a falling exchange rate making imports more expensive. For centuries, the true reserve currency has been gold. The recent price advances to near-all-time highs may indicate more people waking up to this reality.
Data Source: https://fred.stlouisfed.org/series/BOPGSTB
Data Updated: Monthly on one month lag
Last Updated: Apr 05, 2023, for Feb 2023
US Debt interactive charts and graphs can always be found on the Exploring Finance dashboard: https://exploringfinance.shinyapps.io/USDebt/

Call 1-888-GOLD-160 and speak with a Precious Metals Specialist today!
Buka akaun dagangan patuh syariah anda di Weltrade.
Source link