Please note: the CoTs report was published 03/31/2023 for the period ending 03/28/2023. “Managed Money” and “Hedge Funds” are used interchangeably.
*This is the first CoTs report in three months because of the issues the CFTC was having publishing data.
Gold
Current Trends
Gold has had a very strong rally over the last few weeks. Total net open interest is still well below where it was last year, despite a higher price. For example, open interest exceeded 280k contracts last year with a price of $1950. The latest report has open interest around 200k with a price of $1975.

Figure: 1 Net Position by Holder
The driver continues to be Managed Money. The correlation in the chart below shows how much they are driving prices. One thing to note, similar to above… it is taking less Managed Money longs to push the gold price higher and higher. This can be seen in the final table below in the conclusion. Over the short-term, price movements are nearly perfectly correlated, but the correlation collapses over the long-term. This makes sense as the gold price has increased over time but open interest from Managed Money fluctuates up and down.
An example of this would be looking at Nov 16th, 2021 where Managed Money open interest was 142k and the gold price closed at $1853. Those figures in the latest week are 99k with a price of $1972. This shows that less Managed Money is needed to push prices higher. This should be a bullish sign because if Managed Money really got behind the gold rally, prices could take off. Add in the physical constraints, and 2023 could shape up as a banner year for the yellow metal.
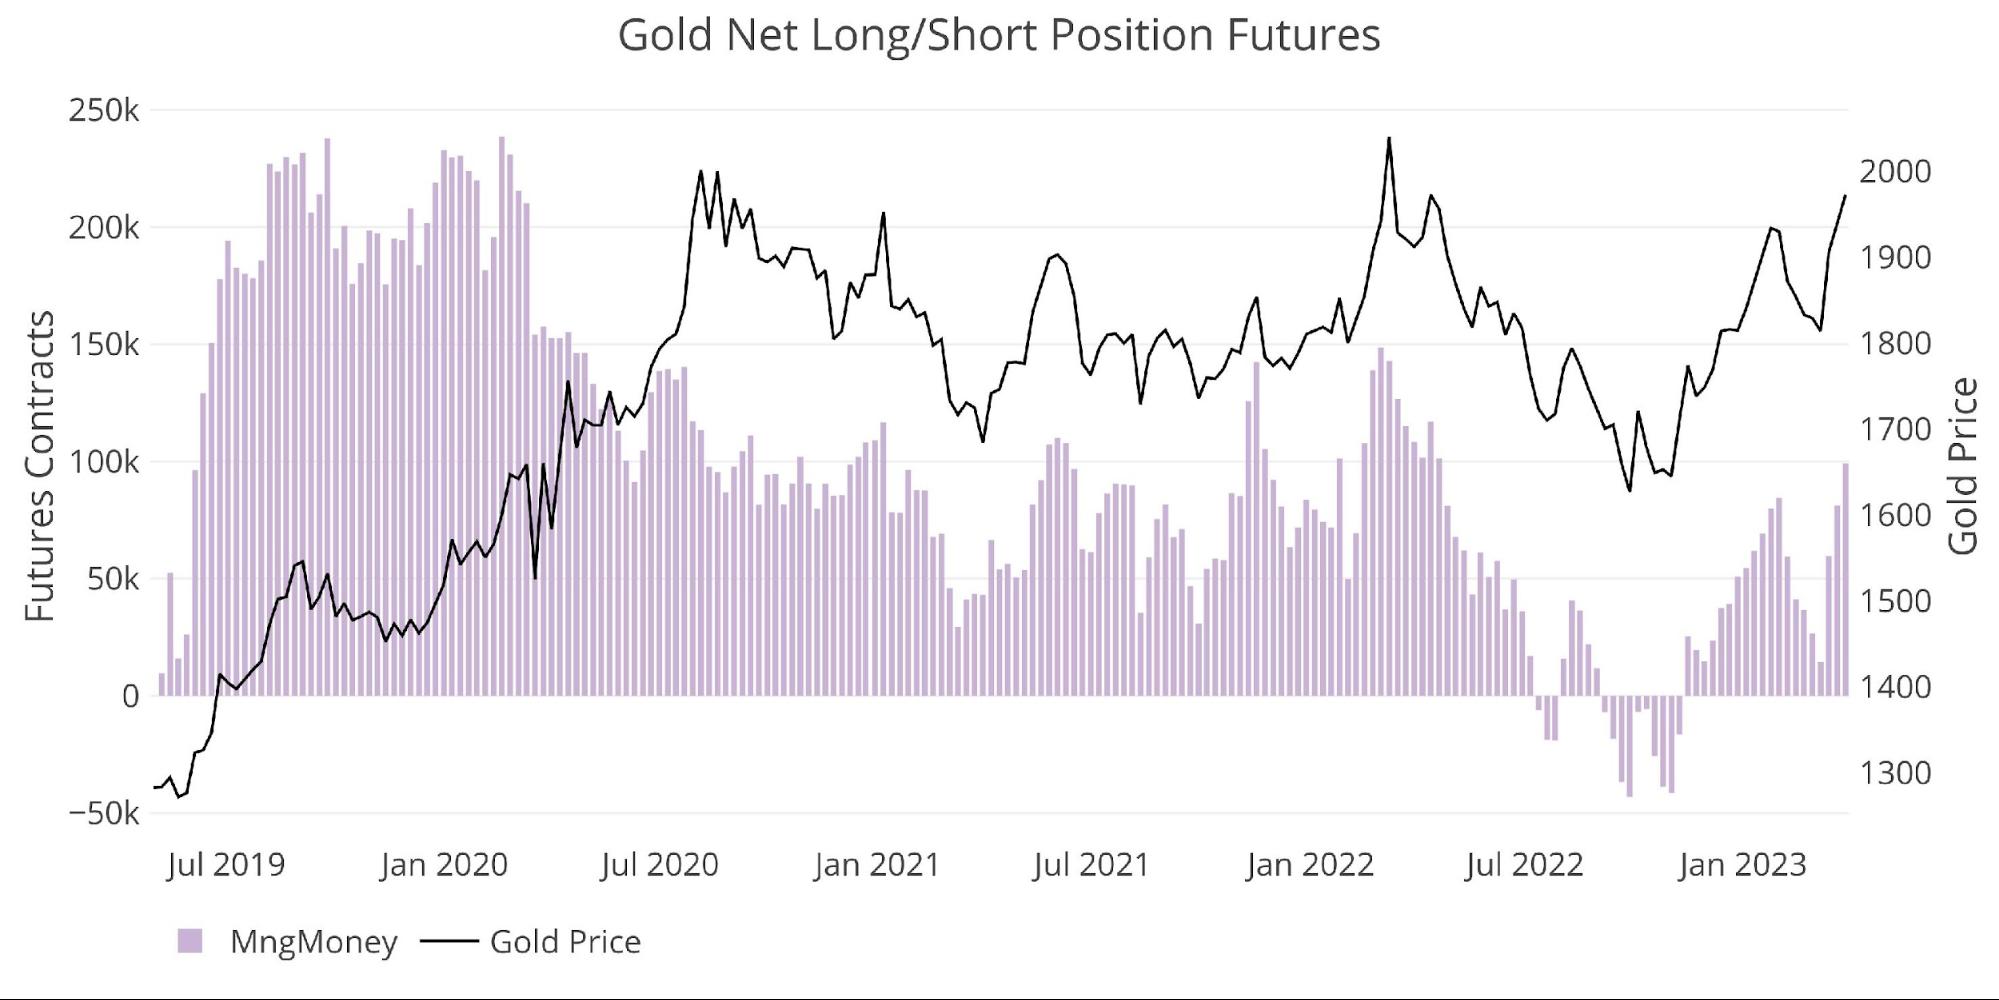
Figure: 2 Managed Money Net Position
Weak Hands at Work
Managed Money is always all over the place. Swap sits on the other side, providing liquidity to Managed Money. The chart below shows the weekly fluctuations and how quickly Managed Money will re-position portfolios. Their movement is far bigger than the other participants (xSwap).
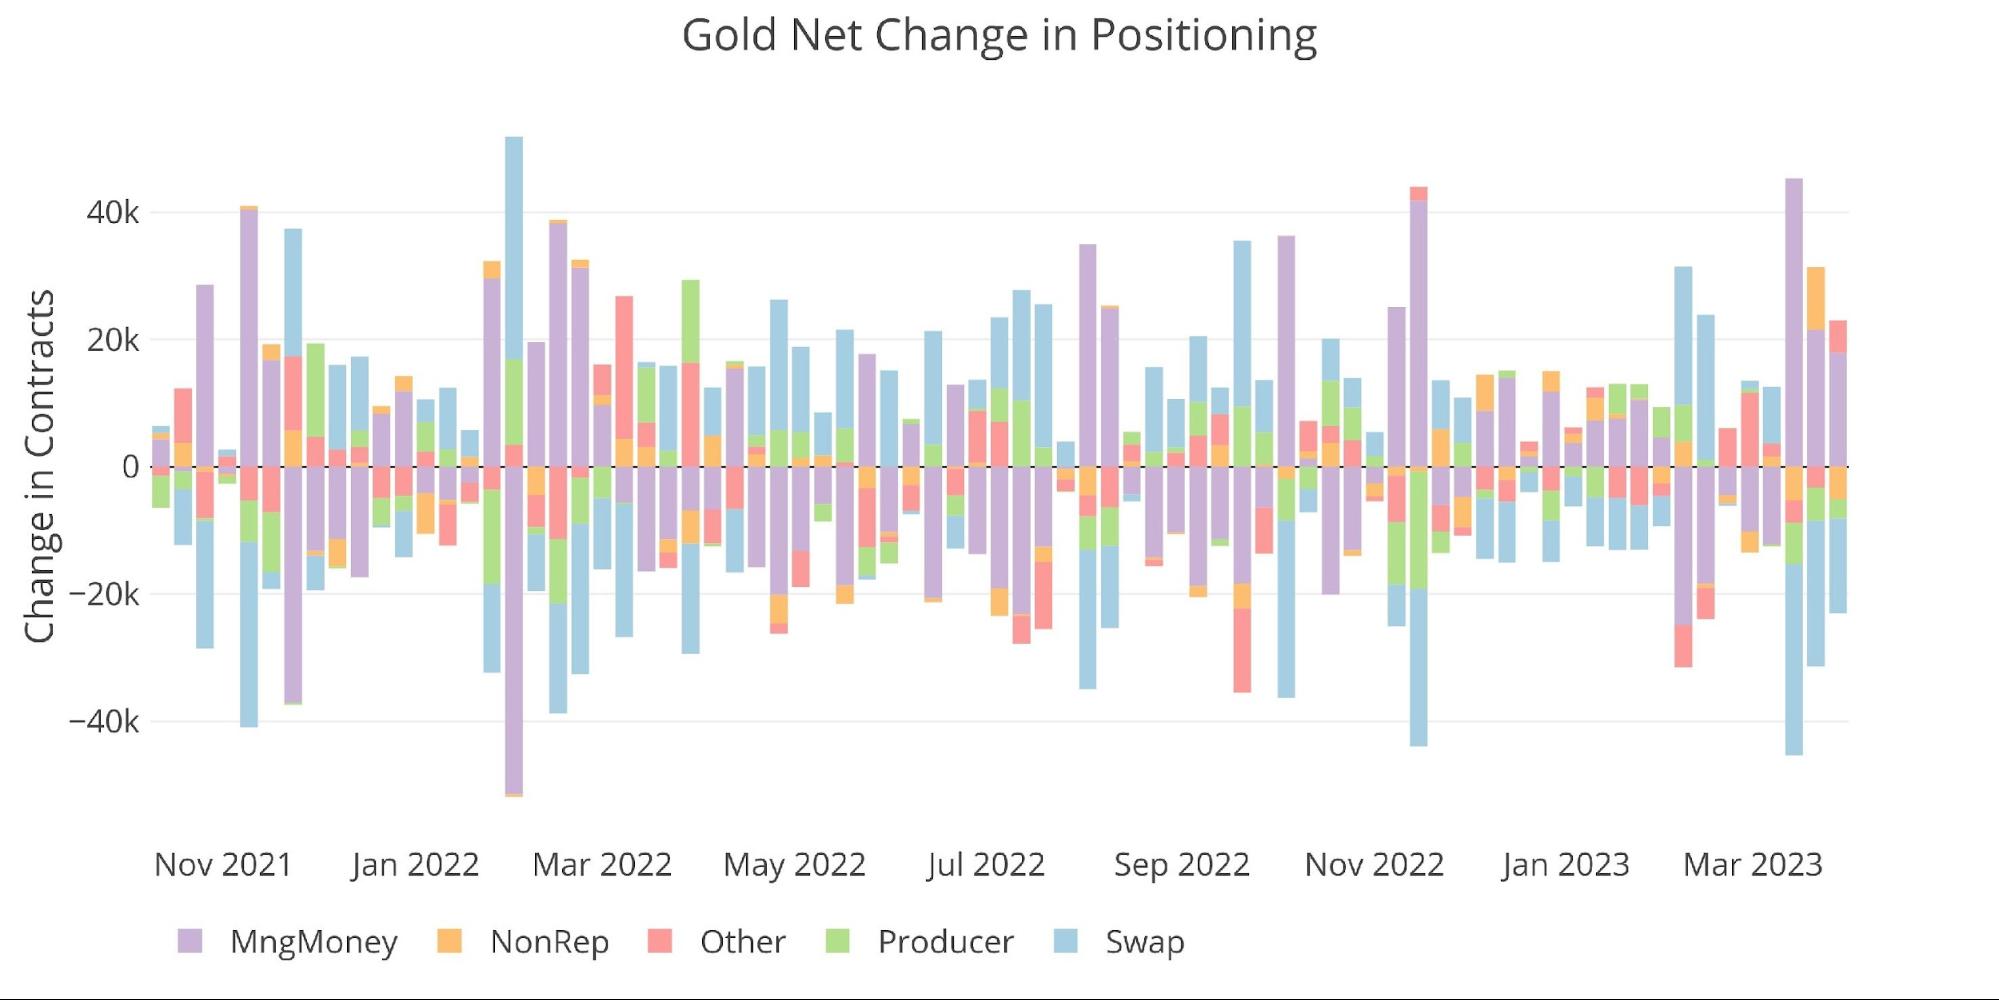
Figure: 3
The table below has detailed positioning information. A few things to highlight:
-
- Over the month, Managed Money change was driven on the long and short side
-
- Gross longs increased 31% while gross shorts decreased 57%
- The result is an increase in net longs of 273%
-
- Other was unchanged for the month
- Swap and Producers saw their net short positions increase by 60% and 52% respectively
-
- Swap was driven completely by increased shorts where Producers saw gross longs and shorts increase, though shorts grew much faster
-
- Over the month, Managed Money change was driven on the long and short side
One more thing to note is that every participant has reduced their net positioning significantly over the last year, ranging from 8% to 45%. This shows the shrinking of overall net positioning over the last 12 months. The futures market is getting smaller, though it is larger than it was in October when net positioning bottomed at just over 100k contracts.
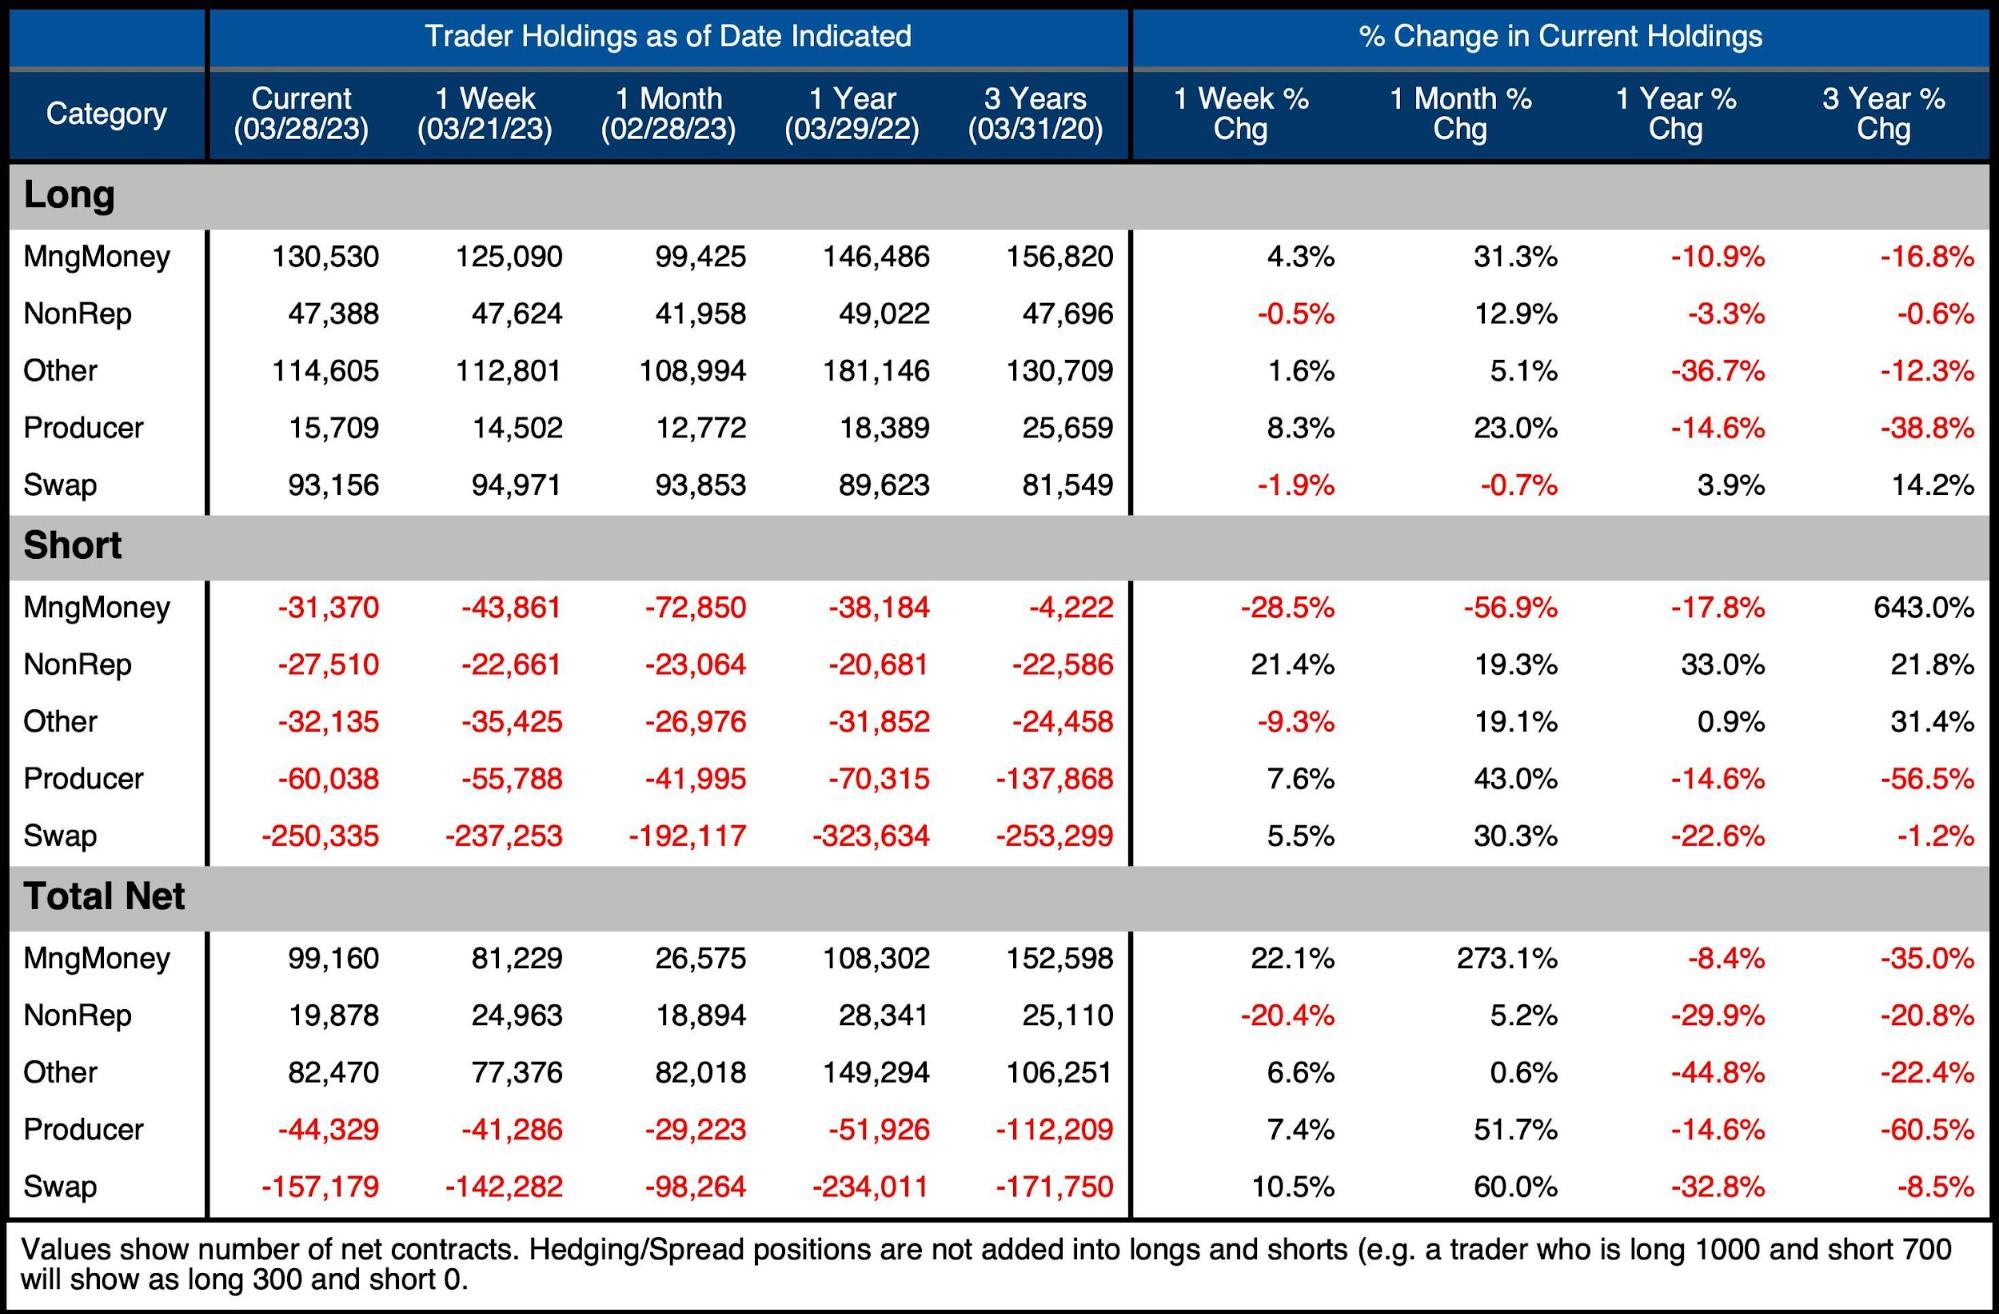
Figure: 4 Gold Summary Table
This can be seen in the chart below where net positioning reached 22% in November 2022 and has since rebounded to 42%.
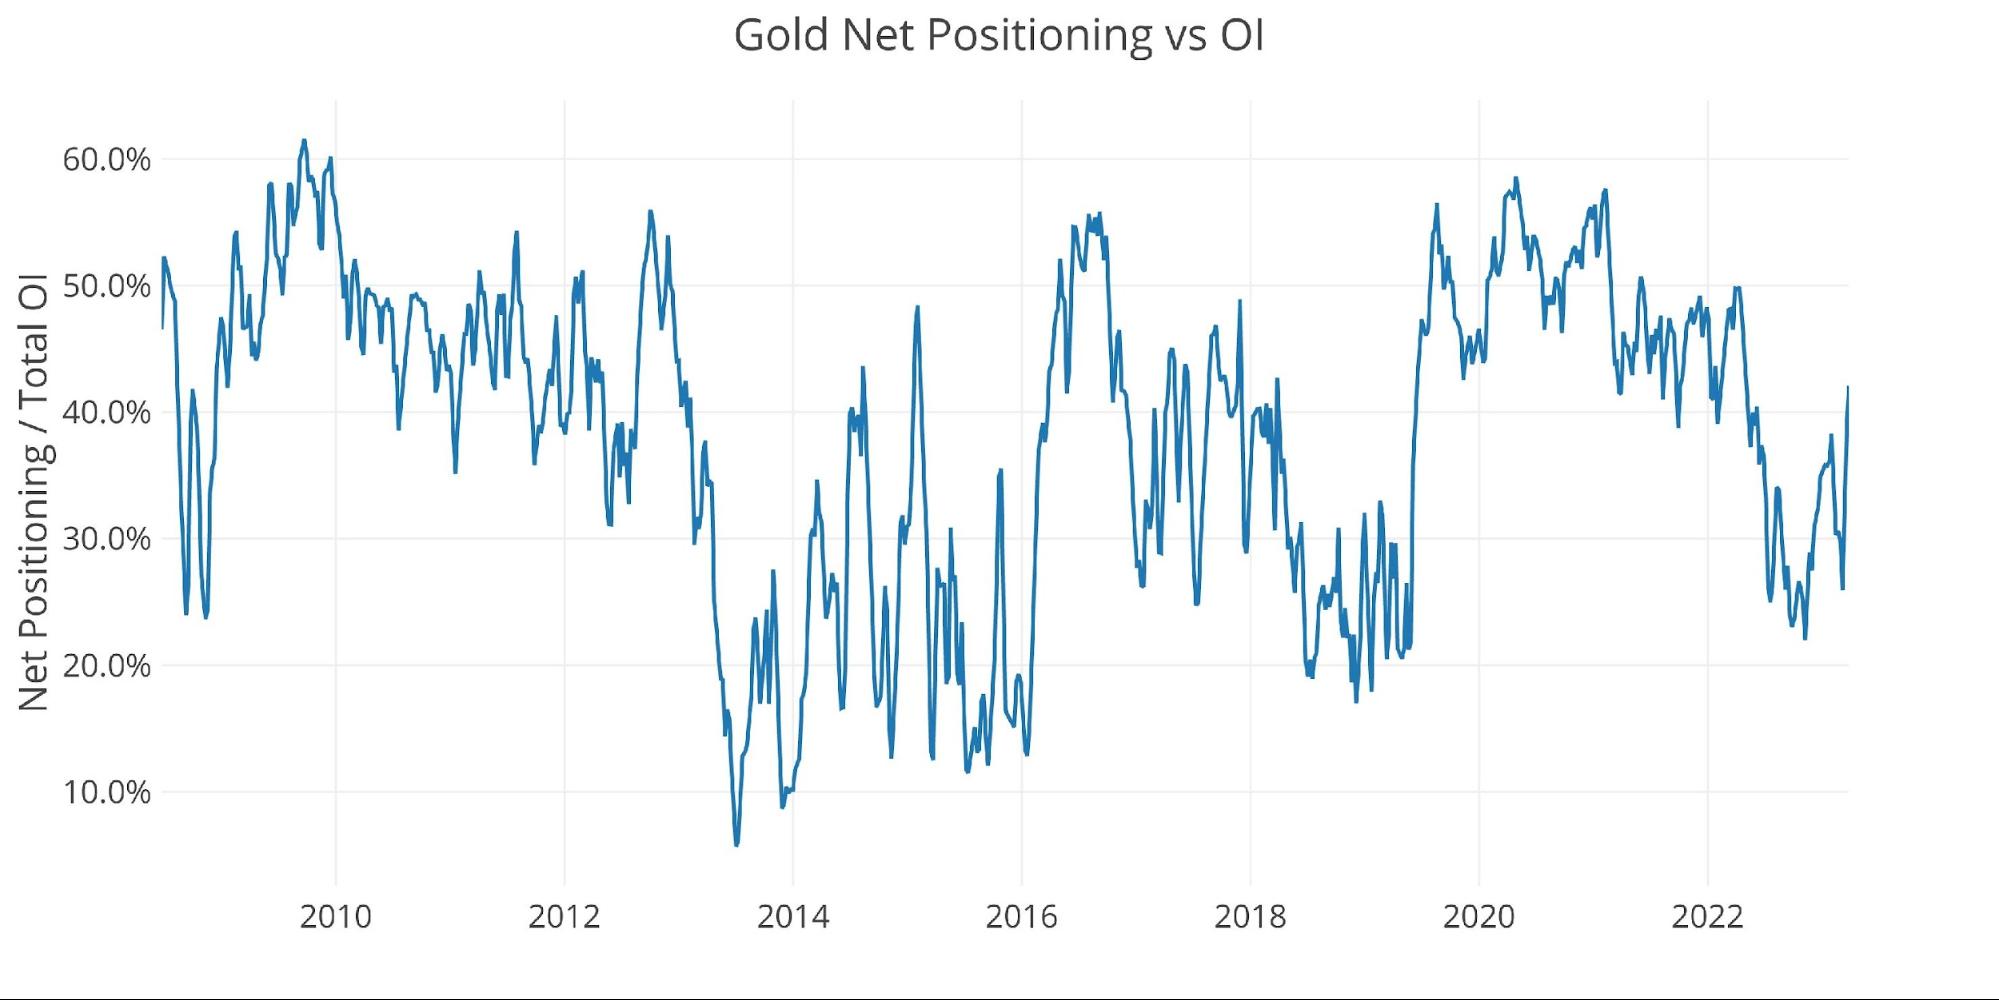
Figure: 5 Net Positioning
Historical Perspective
Looking over the full history of the CoTs data by month produces the chart below (values are in dollar/notional amounts, not contracts). Gross positioning topped out just shy of $100B in Feb 2022 and then crashed all the way to $58B as of Sept 2022. It has since rebounded to $80B in March. This means there is still dry powder on the sidelines waiting for the moment to pile back into the market. This will likely happen if gold can get over the $2,000 hurdle with conviction.
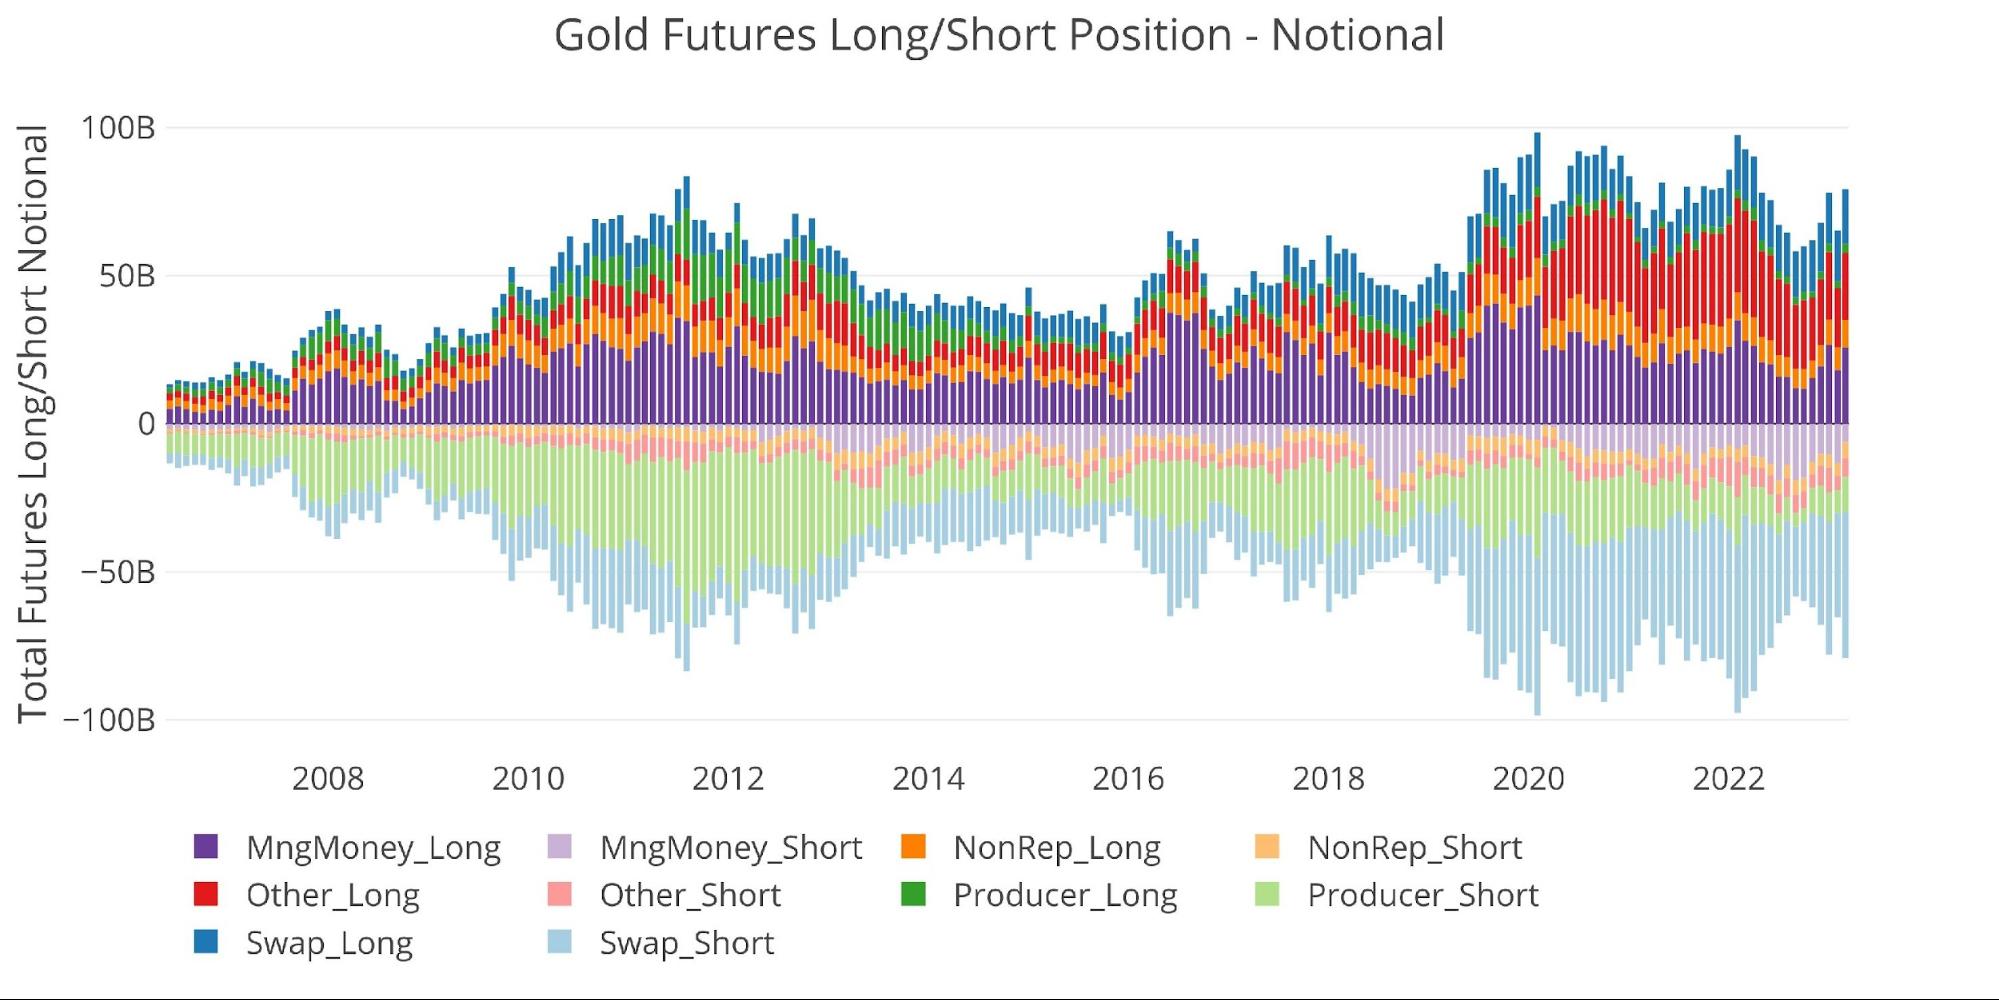
Figure: 6 Gross Open Interest
The market came under immense selling pressure late last year but has rebounded. Again, the price is reaching close to new highs even though open interest is lagging.

Figure: 7 Net Notional Position
The options market is also showing signs of life, with positions closing in on $10B. This is well below the $26B+ record seen in July 2020, but more than triple the $3B in September last year.
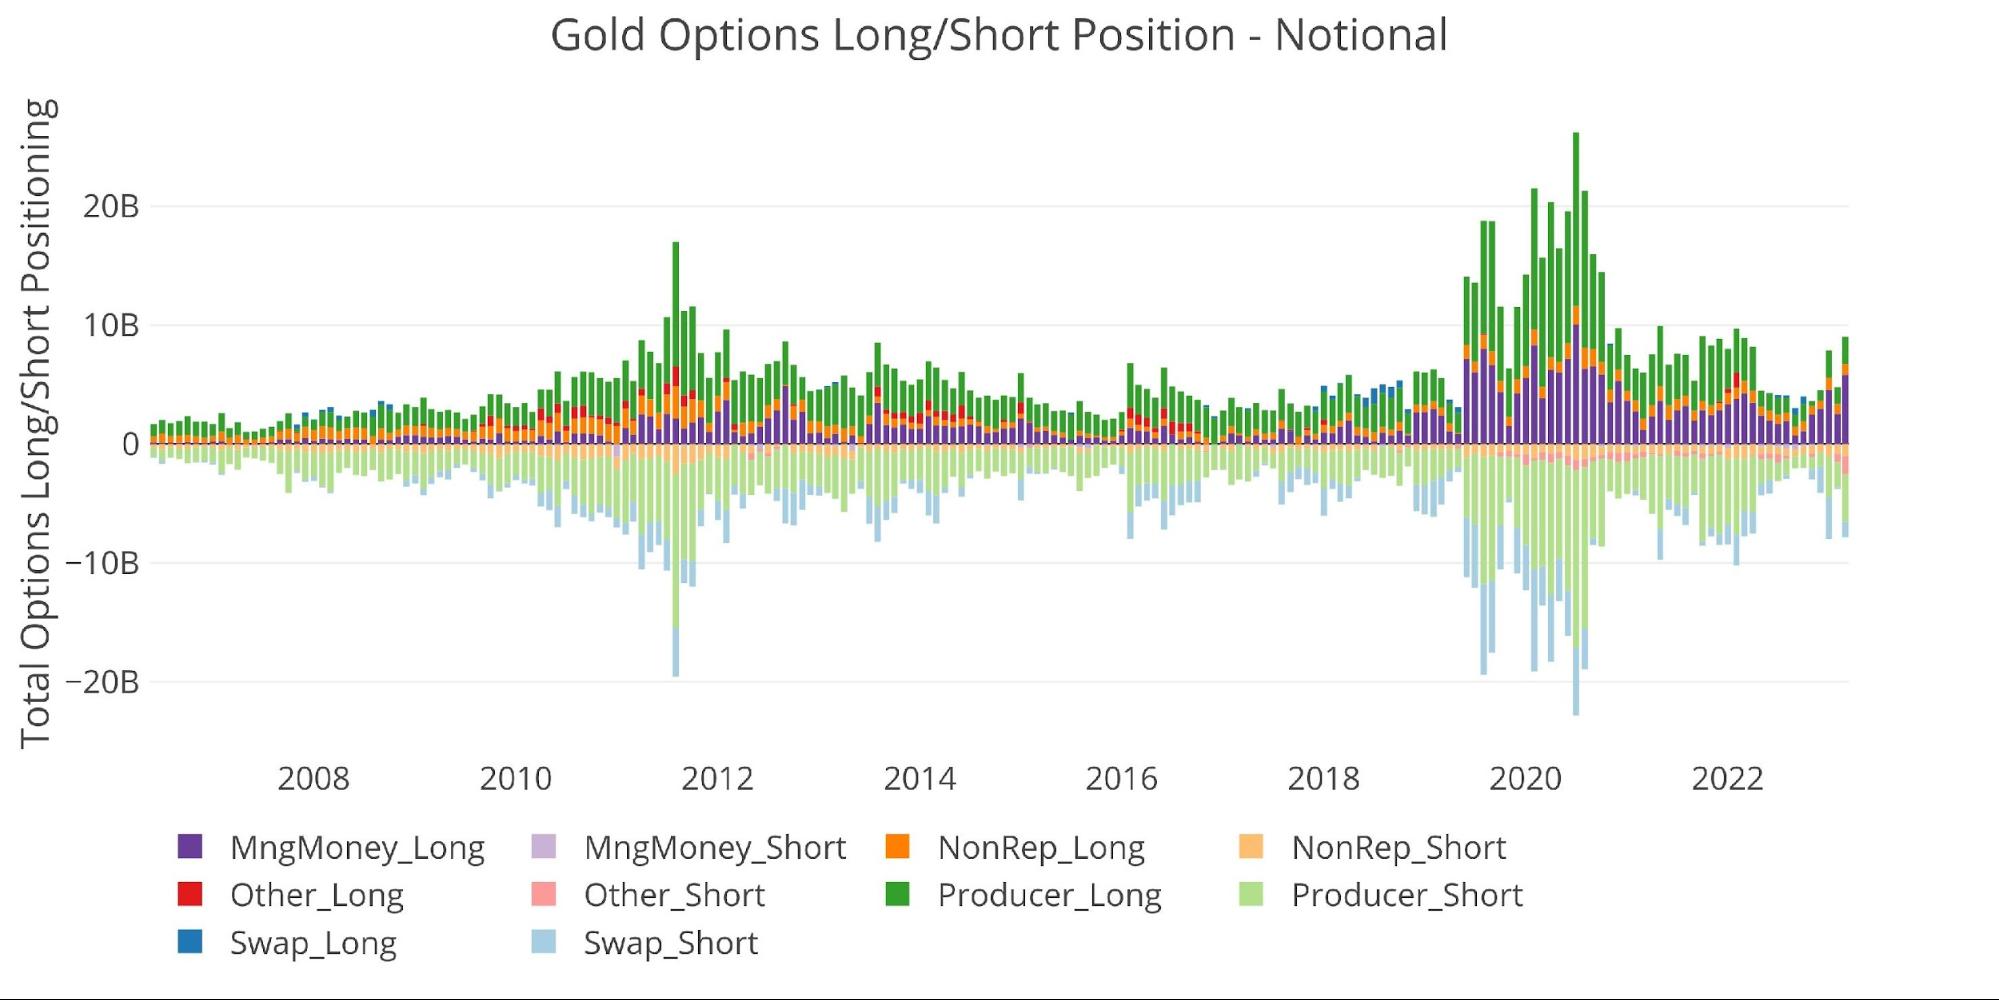
Figure: 8 Options Positions
Silver
Current Trends
Silver seems to be driven by factors beyond just open interest. The chart below shows that open interest has been fairly flat since the beginning of February, yet the price has seen a very large rally.

Figure: 9 Net Position by Holder
No doubt Managed Money is still a factor, but similar to gold… it is not the only driver. For example, net long is now at 10.2k contracts with a price of $23.32. Back in November, net long was at 11.7k but the price was only $21. This means that net longs are 13% lower but the price is 11% higher. Again, if Managed Money were to really get behind this latest move, then the price could explode to the upside.
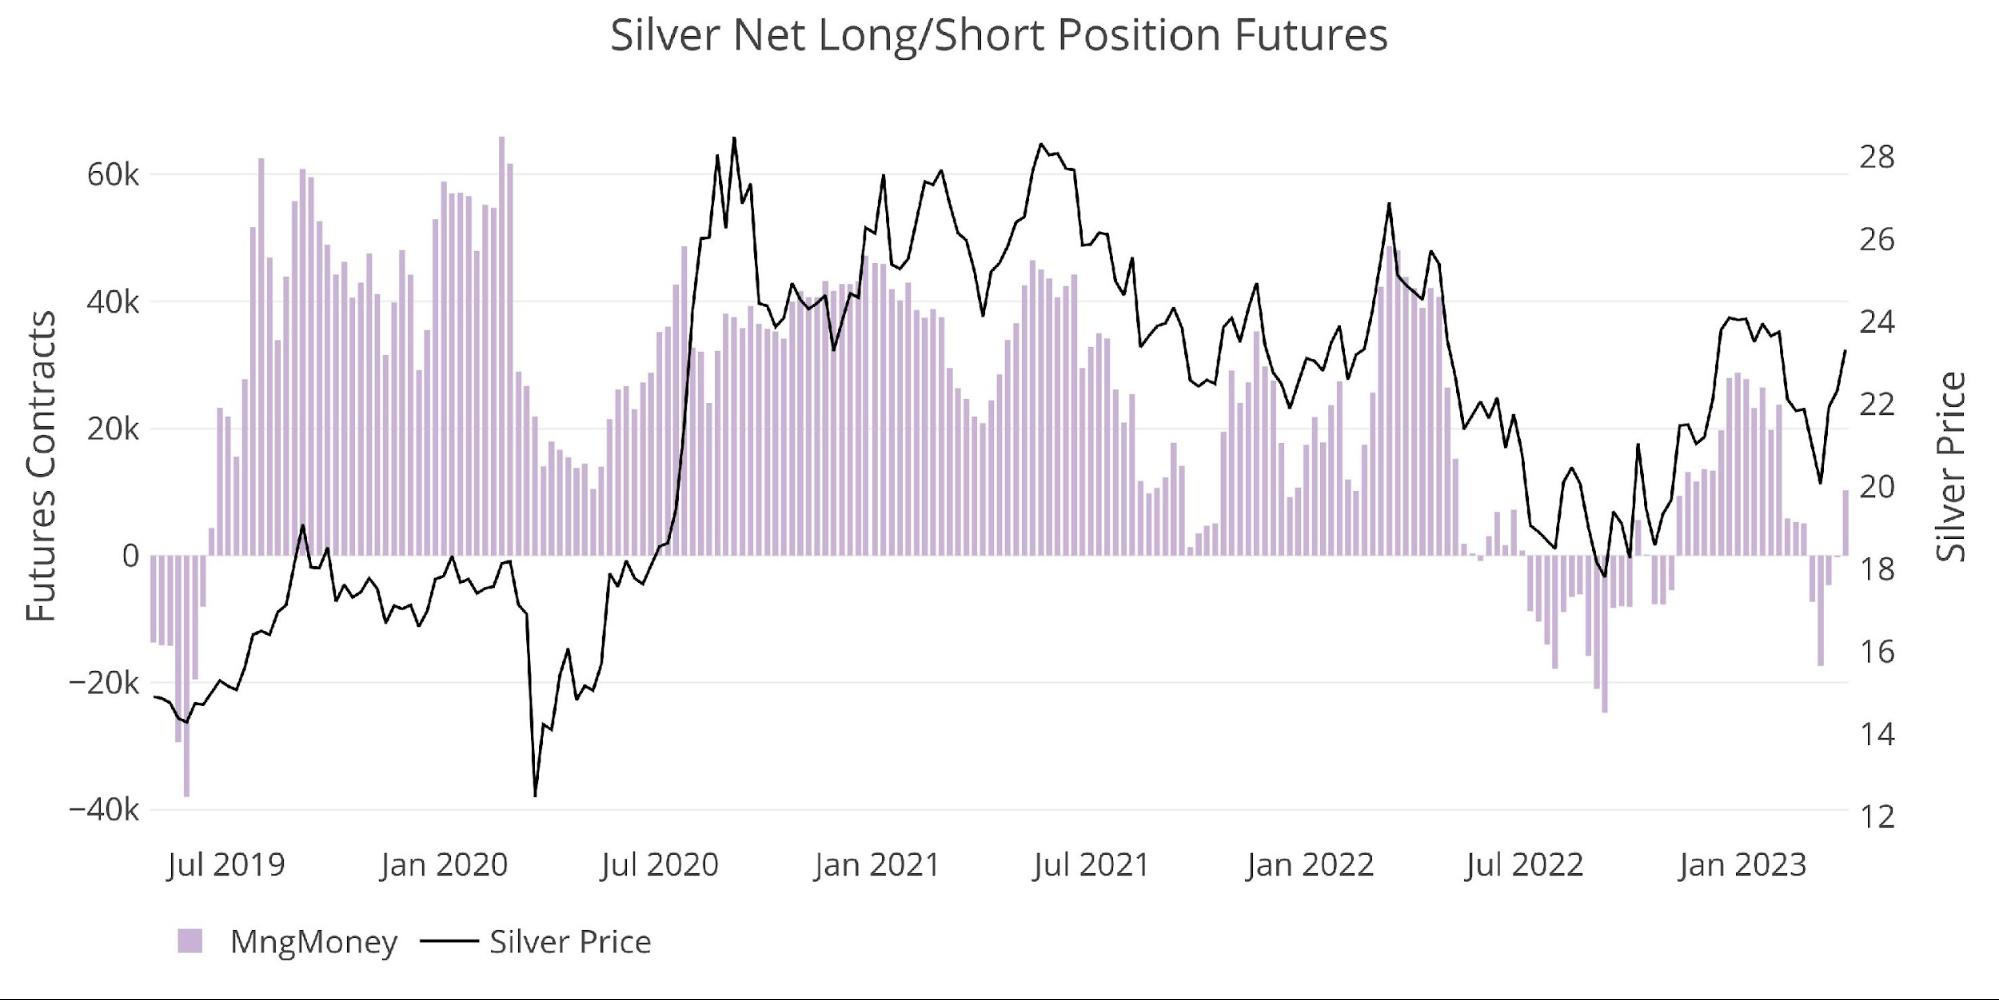
Figure: 10 Managed Money Net Position
The weekly movement can be seen below. Other saw a big reduction in mid-March with the collapse of SVB, but Managed Money has been on the other side, buying in earnest for the last 3 weeks.
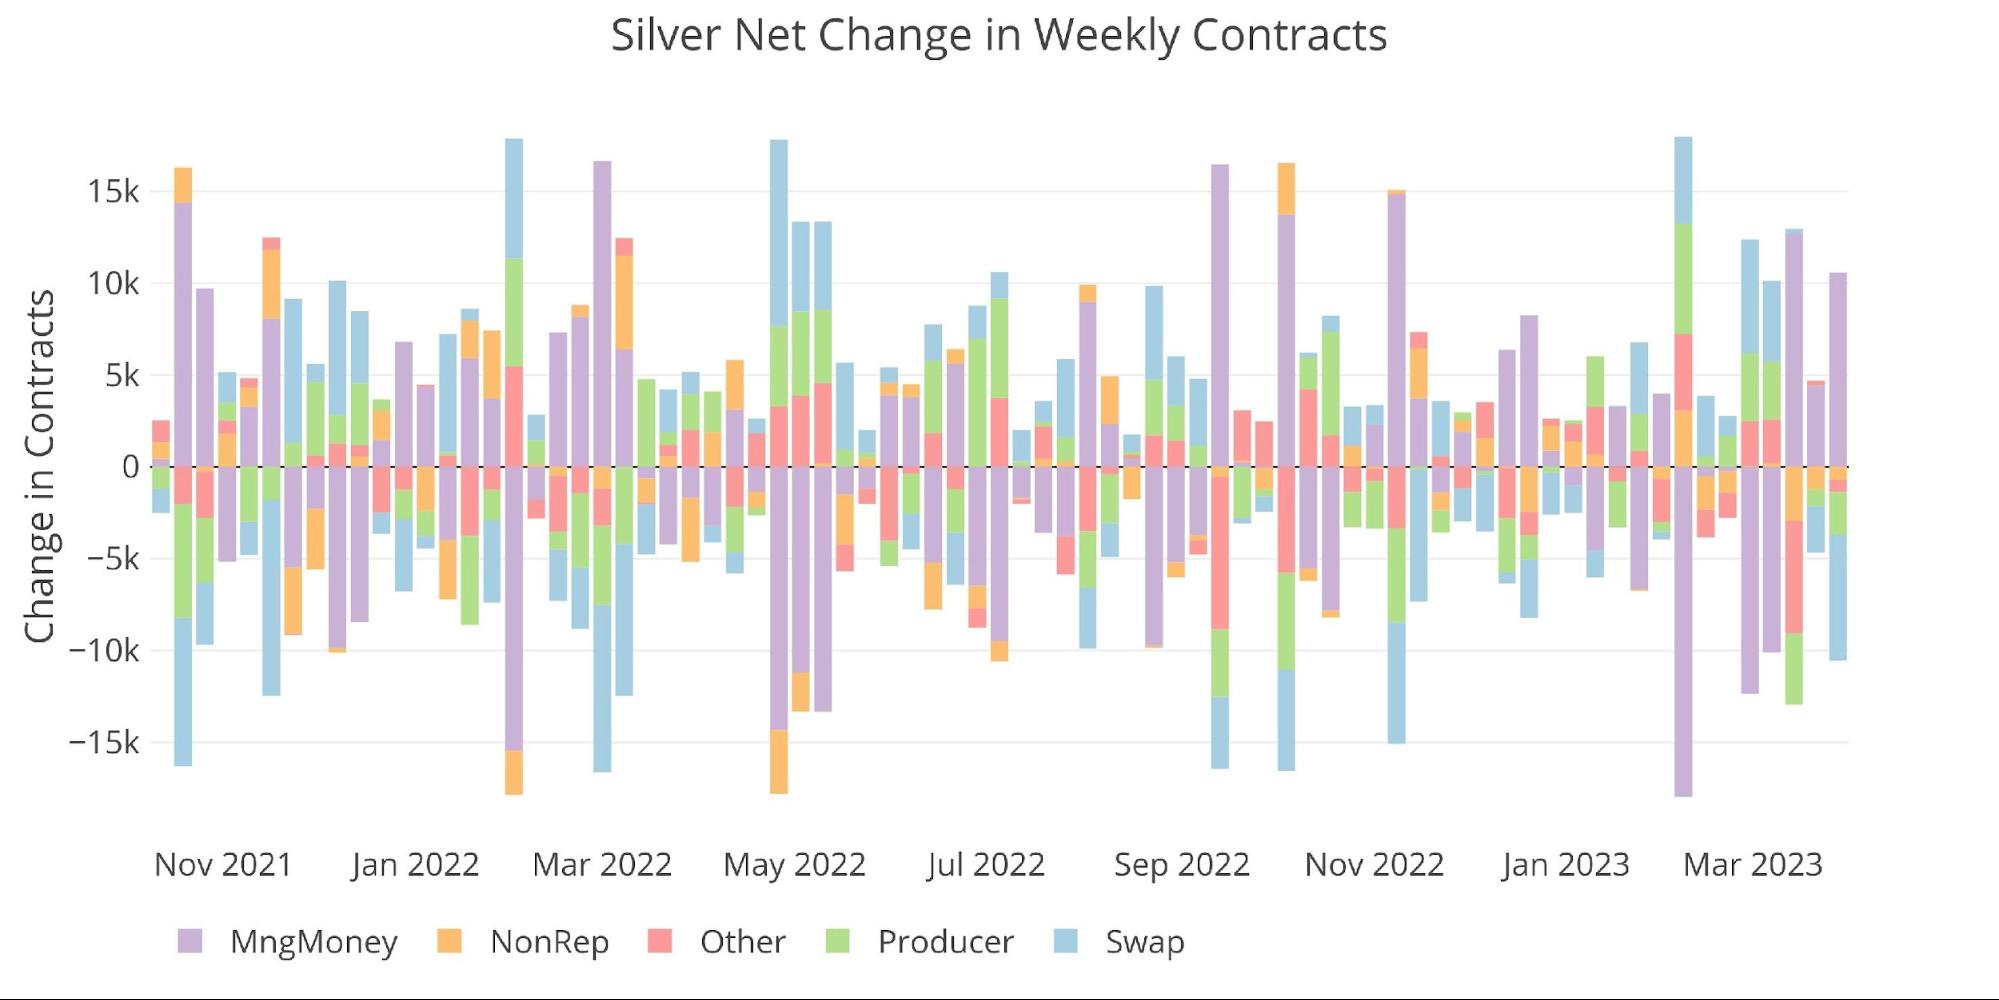
Figure: 11 Net Change in Positioning
The table below shows a series of snapshots in time. This data does NOT include options or hedging positions. Important data points to note:
-
- The change in Managed Money is primarily driven by shorts
-
- Gross longs increased 1,600 contracts or 5.2%
- Gross shorts collapsed 10x greater with 16k contracts closing or 42.5%
- This led to a net change of -241%
-
- Other and Swap also saw their net long positions drop by 57% and 50% respectively
-
- This was driven by both a reduction in longs and an increase in shorts for both groups
-
- The change in Managed Money is primarily driven by shorts

Figure: 12 Silver Summary Table
Net positioning in silver has not rebounded the way it has in gold. After a brief jump back to 34%, it has dropped back to 22%, suggesting a more neutral market. While the futures market has moved towards a more neutral stance, the price has moved up big. This means the price is being driven beyond just the positioning in the futures market.
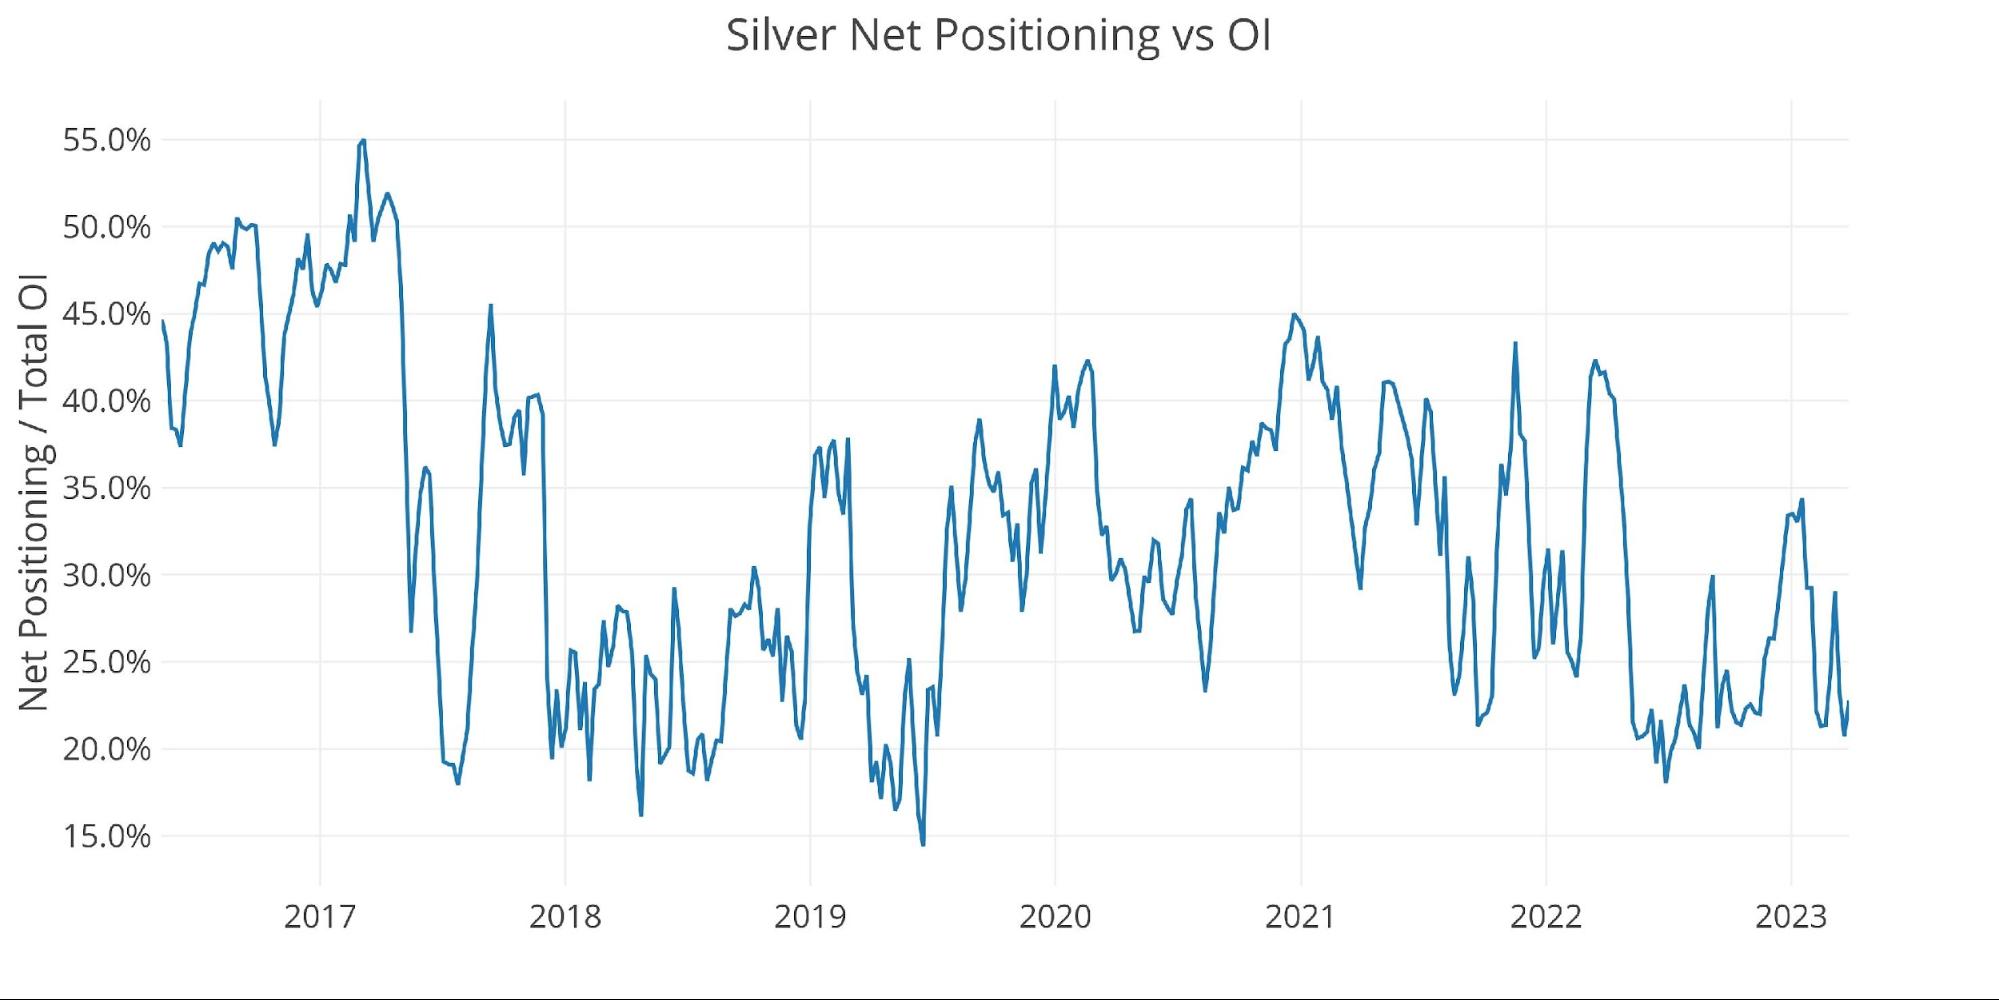
Figure: 13 Net Positioning
Historical Perspective
Looking over the full history of the CoTs data by month produces the chart below. The latest two weeks are still near multi-year lows from a gross positioning standpoint. The price is on the move up but lacks the interest that silver saw in response to Covid. This suggests firepower on the sidelines that could really get the price moving.
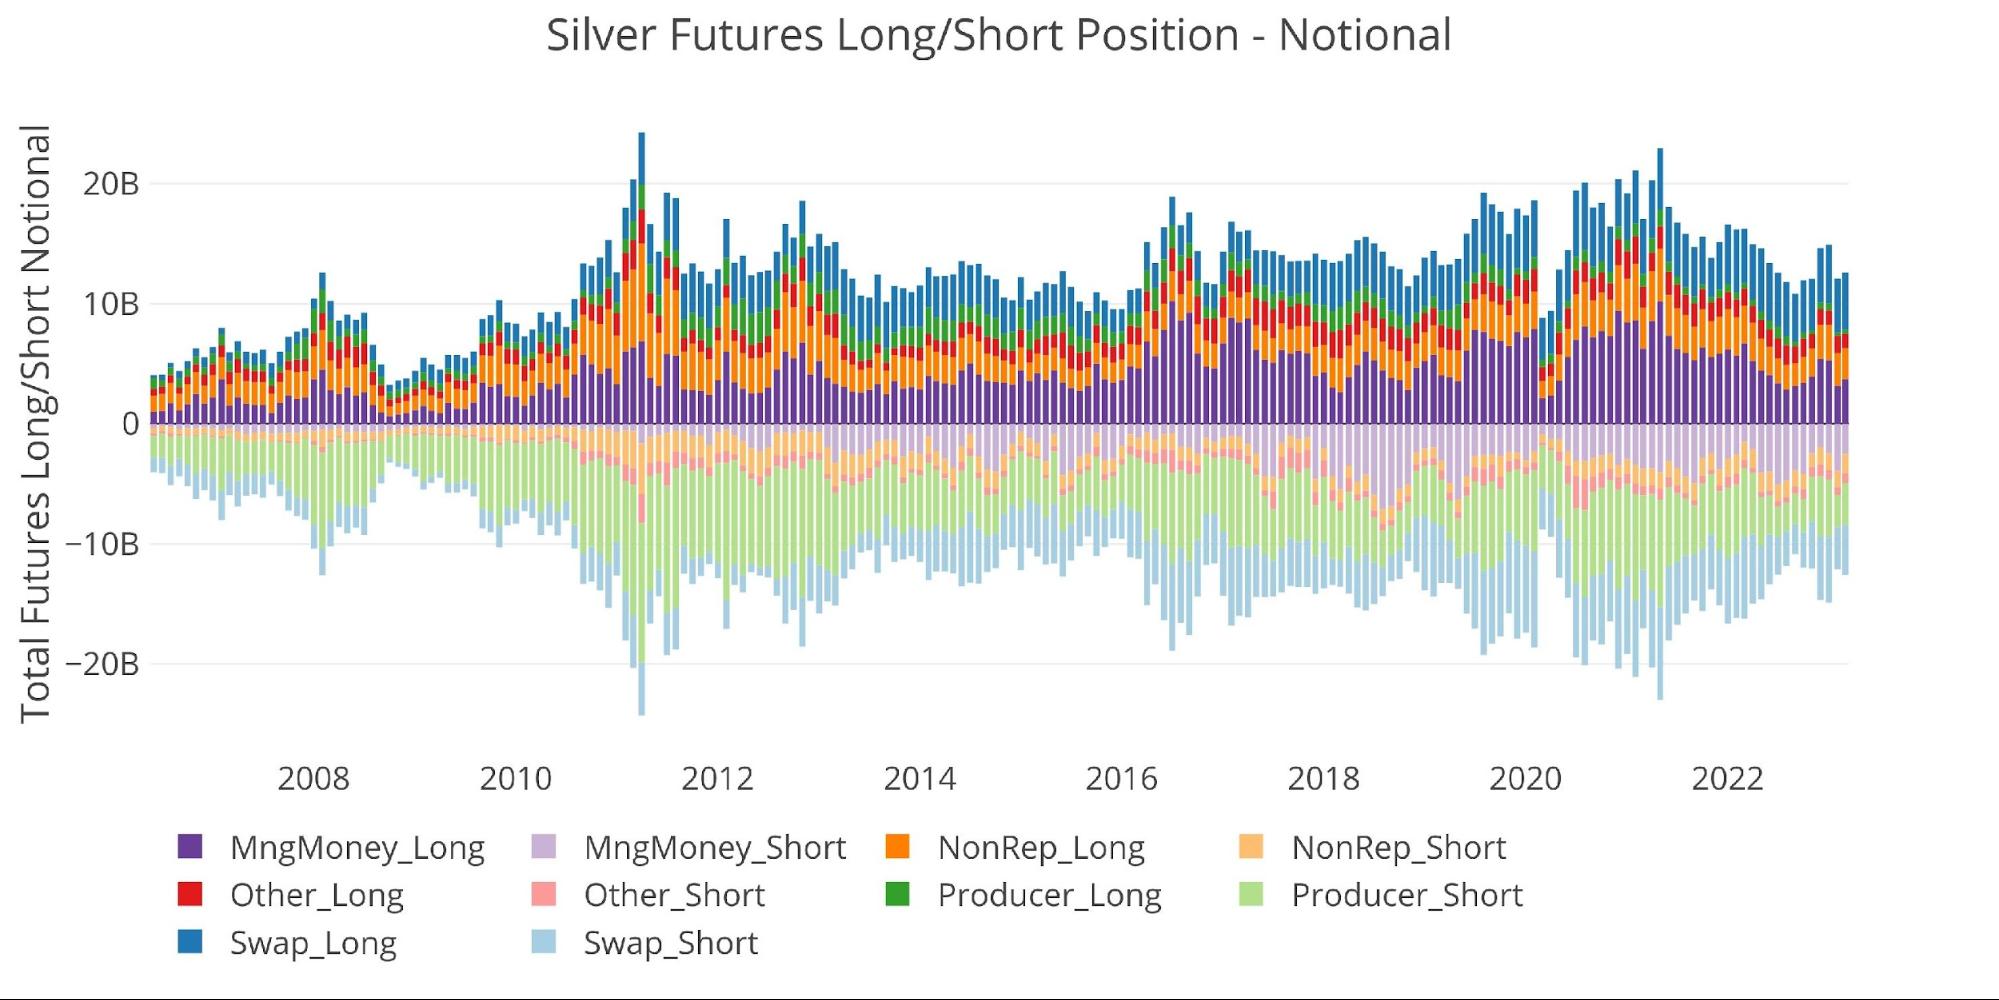
Figure: 14 Gross Open Interest
Managed Money is very volatile in its swings, but right now their net view is to be long by the tune of $1.26B. This is a stark reversal from February when they were net short $743M.

Figure: 15 Net Notional Position
The options market is catching a bid with Other and Non Reporting boosting their gross longs. Managed Money is still pretty quiet.
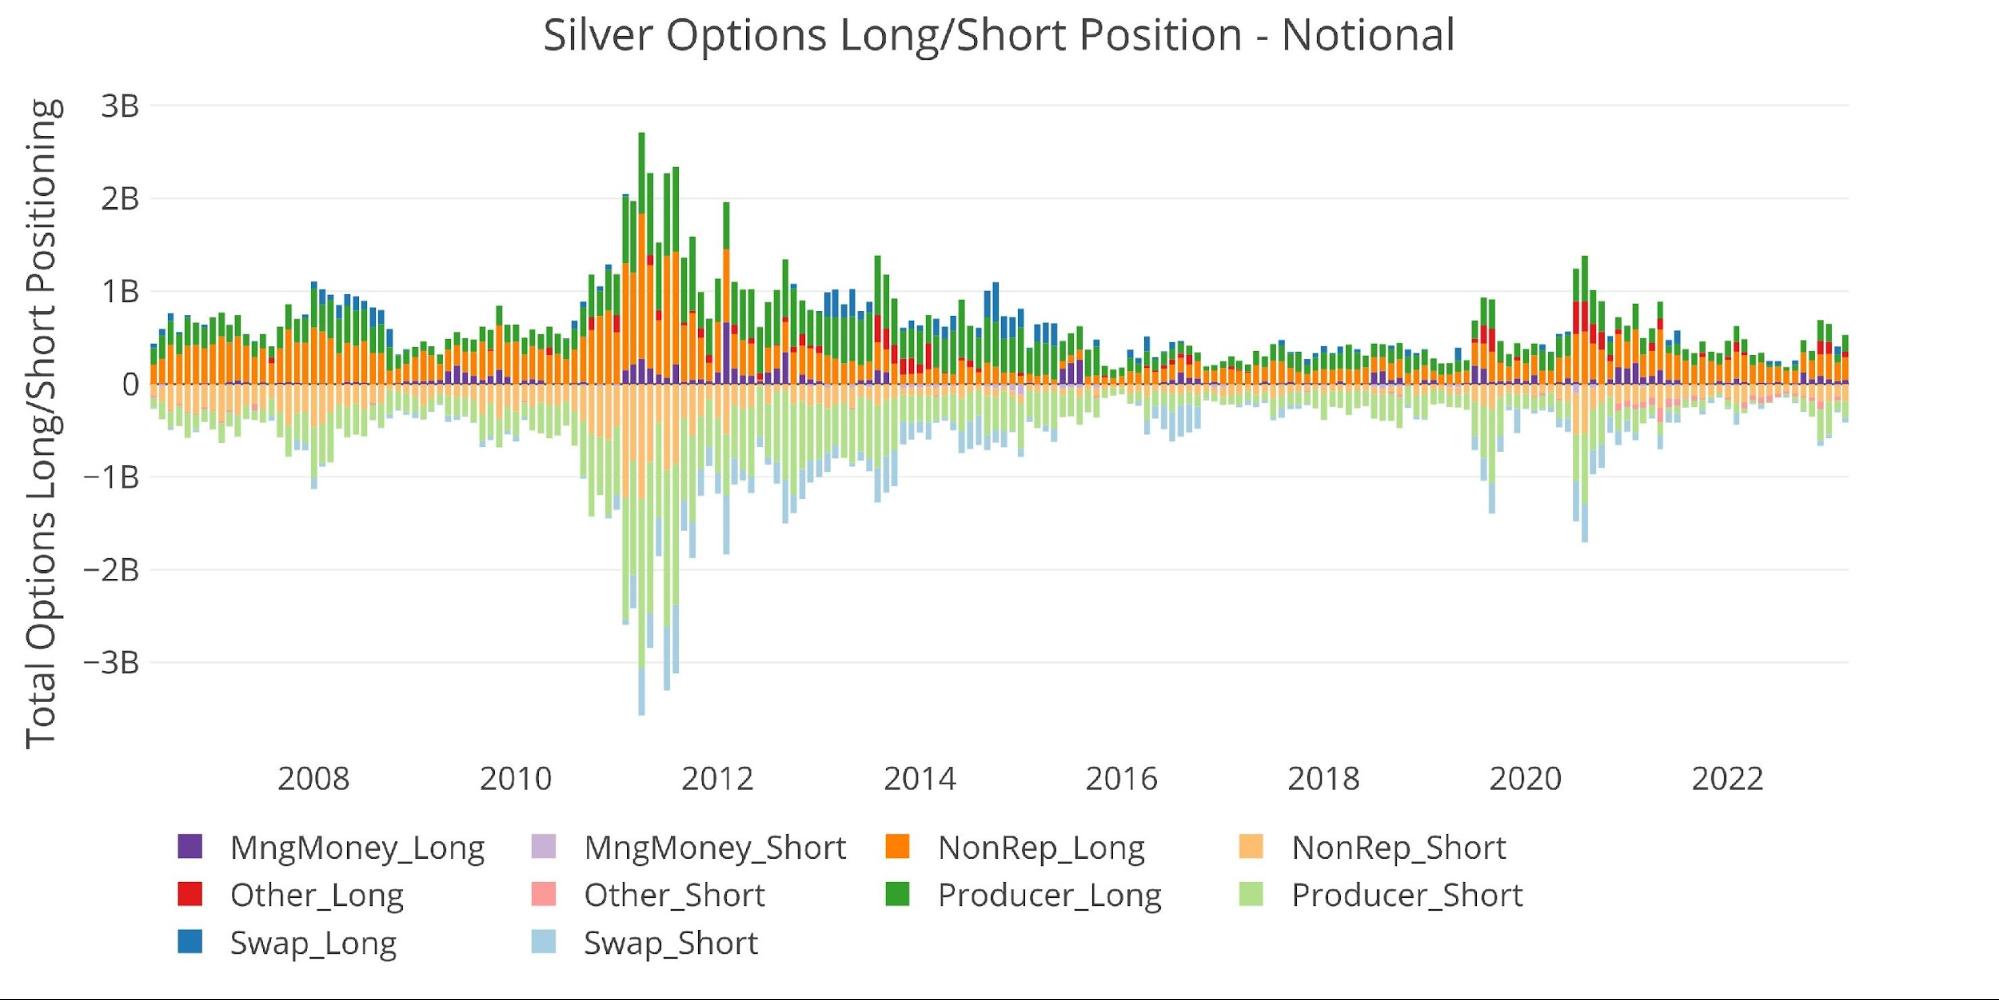
Figure: 16 Options Positions
Conclusion
Over the short-term, Managed Money dominates the price action. This correlation breaks down over the long-term because the overall trend in both gold and silver is up while Managed Money trades around the short-term.
With a correlation of .95, there is no mistake that Managed Money dominates. That is an incredibly strong correlation. However, the long-term correlation drops to near zero. Some of this is definitely driven by the anomaly in 2020, but that is not the only justification. The long-term bull market continues to grind higher.
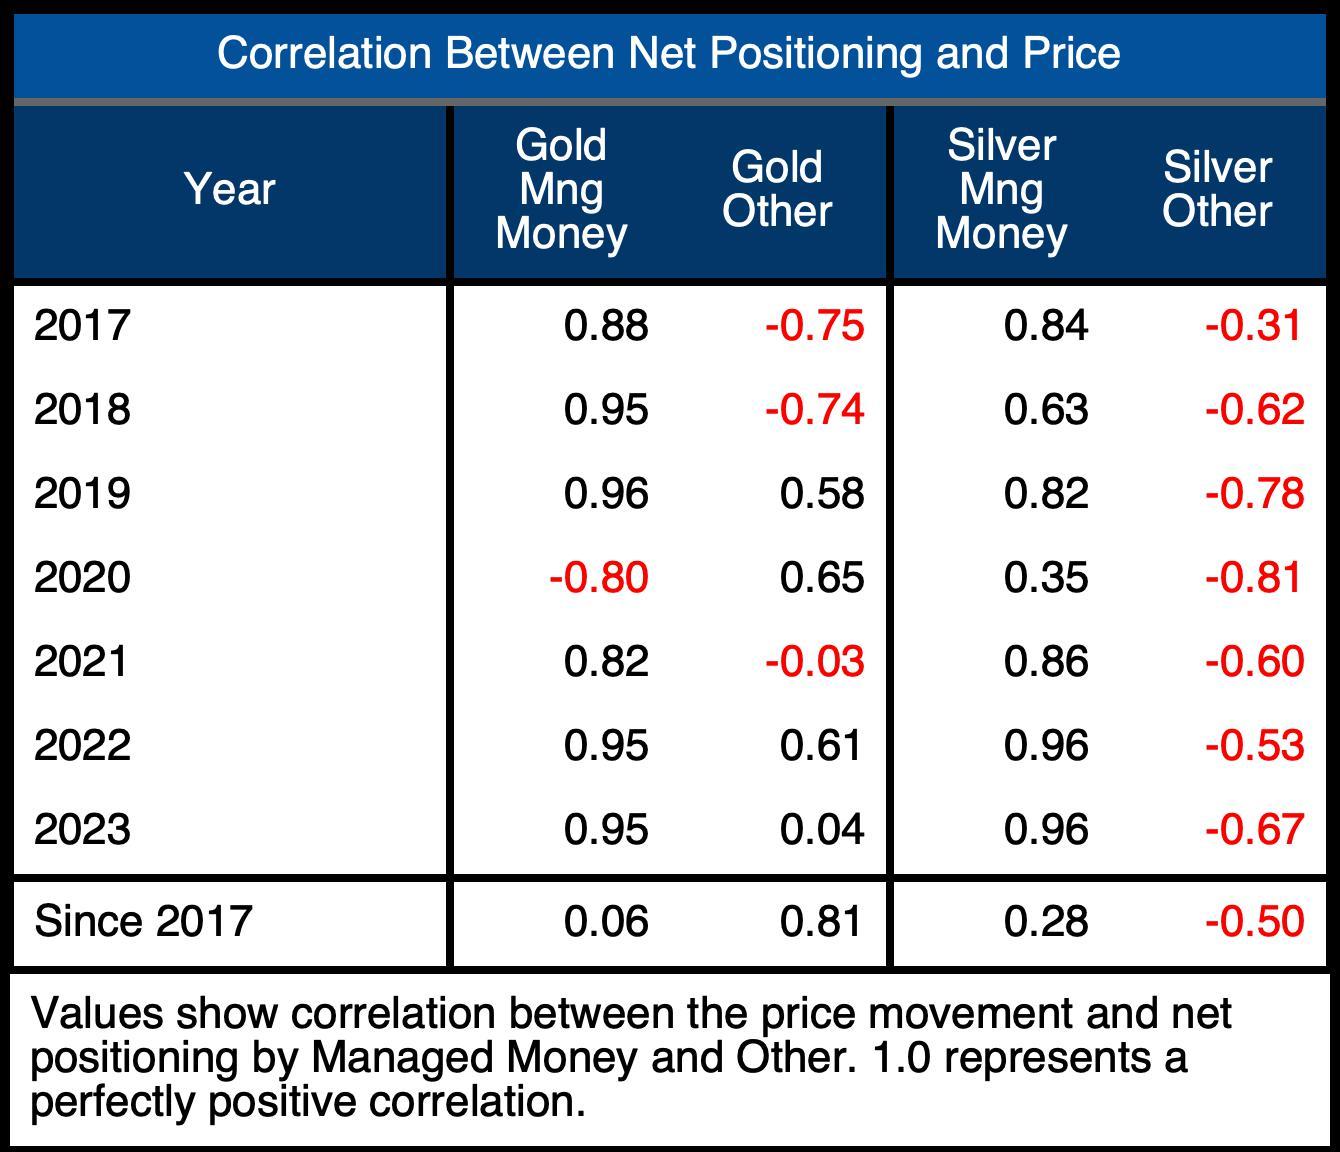
Figure: 17 Correlation Table
The latest price action is potentially even more bullish than normal. The latest price moves have been supported by Managed Money but the data clearly shows there is more driving the upward movement. The physical constraints may definitely be playing a role.
The setup is there… if gold and silver break through resistance then it could mean a big rally for 2023. Gold needs to get through $2,000 with conviction. If Managed Money buys in, they could quickly drive the price much higher.
Data Source: https://www.cftc.gov/MarketReports/CommitmentsofTraders/index.htm
Data Updated: Every Friday at 3:30 PM as of Tuesday
Last Updated: Mar 28, 2023
Gold and Silver interactive charts and graphs can be found on the Exploring Finance dashboard: https://exploringfinance.shinyapps.io/goldsilver/

Call 1-888-GOLD-160 and speak with a Precious Metals Specialist today!
Buka akaun dagangan patuh syariah anda di Weltrade.
Source link