Gold deliveries in February came in quite low for a major month, totaling only 15,055. This is the lowest month going back to February 2020 (pre-Covid). The chart below shows the big spike in deliveries seen after Covid started. While the current month is still above any pre-Covid month, it is small when compared to some of the major delivery months seen recently.
As noted in previous articles, this may be by design. Silver has been leading gold, and saw delivery volumes drop about a year ago. The theory is that there is simply not much metal available for delivery so the Comex is instead pushing people away from delivery.
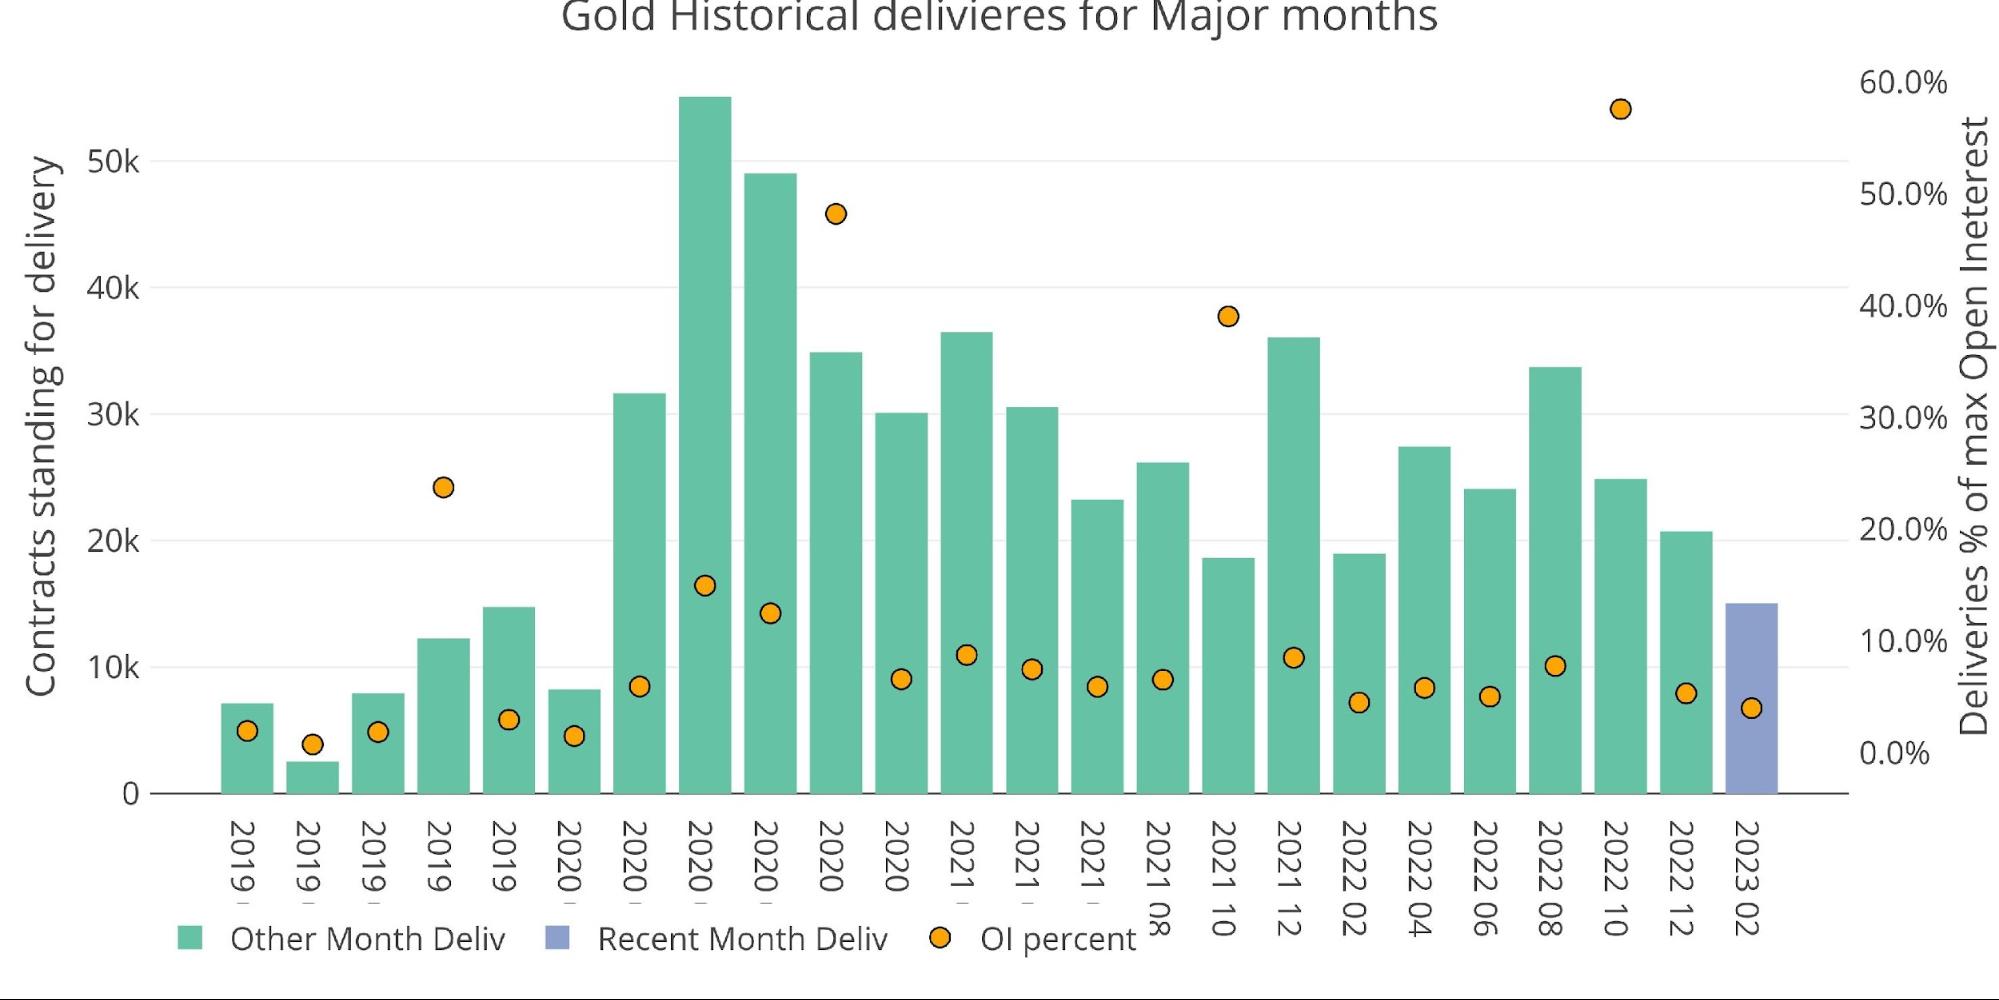
Figure: 1 Recent like-month delivery volume
The hypothesis can be seen in the chart below with the drop of open interest into the close. On the day before First Notice, open interest was actually higher than December and several other months (blue bar). On the final day into the close, there was a massive drop in open interest. The final amount is the green bar below. This was a drop of over 50% on the final day! Large drops in the past have been 30%. This hints at the fact that the contract holders are waiting until the last minute to roll and then find some incentive to do so.
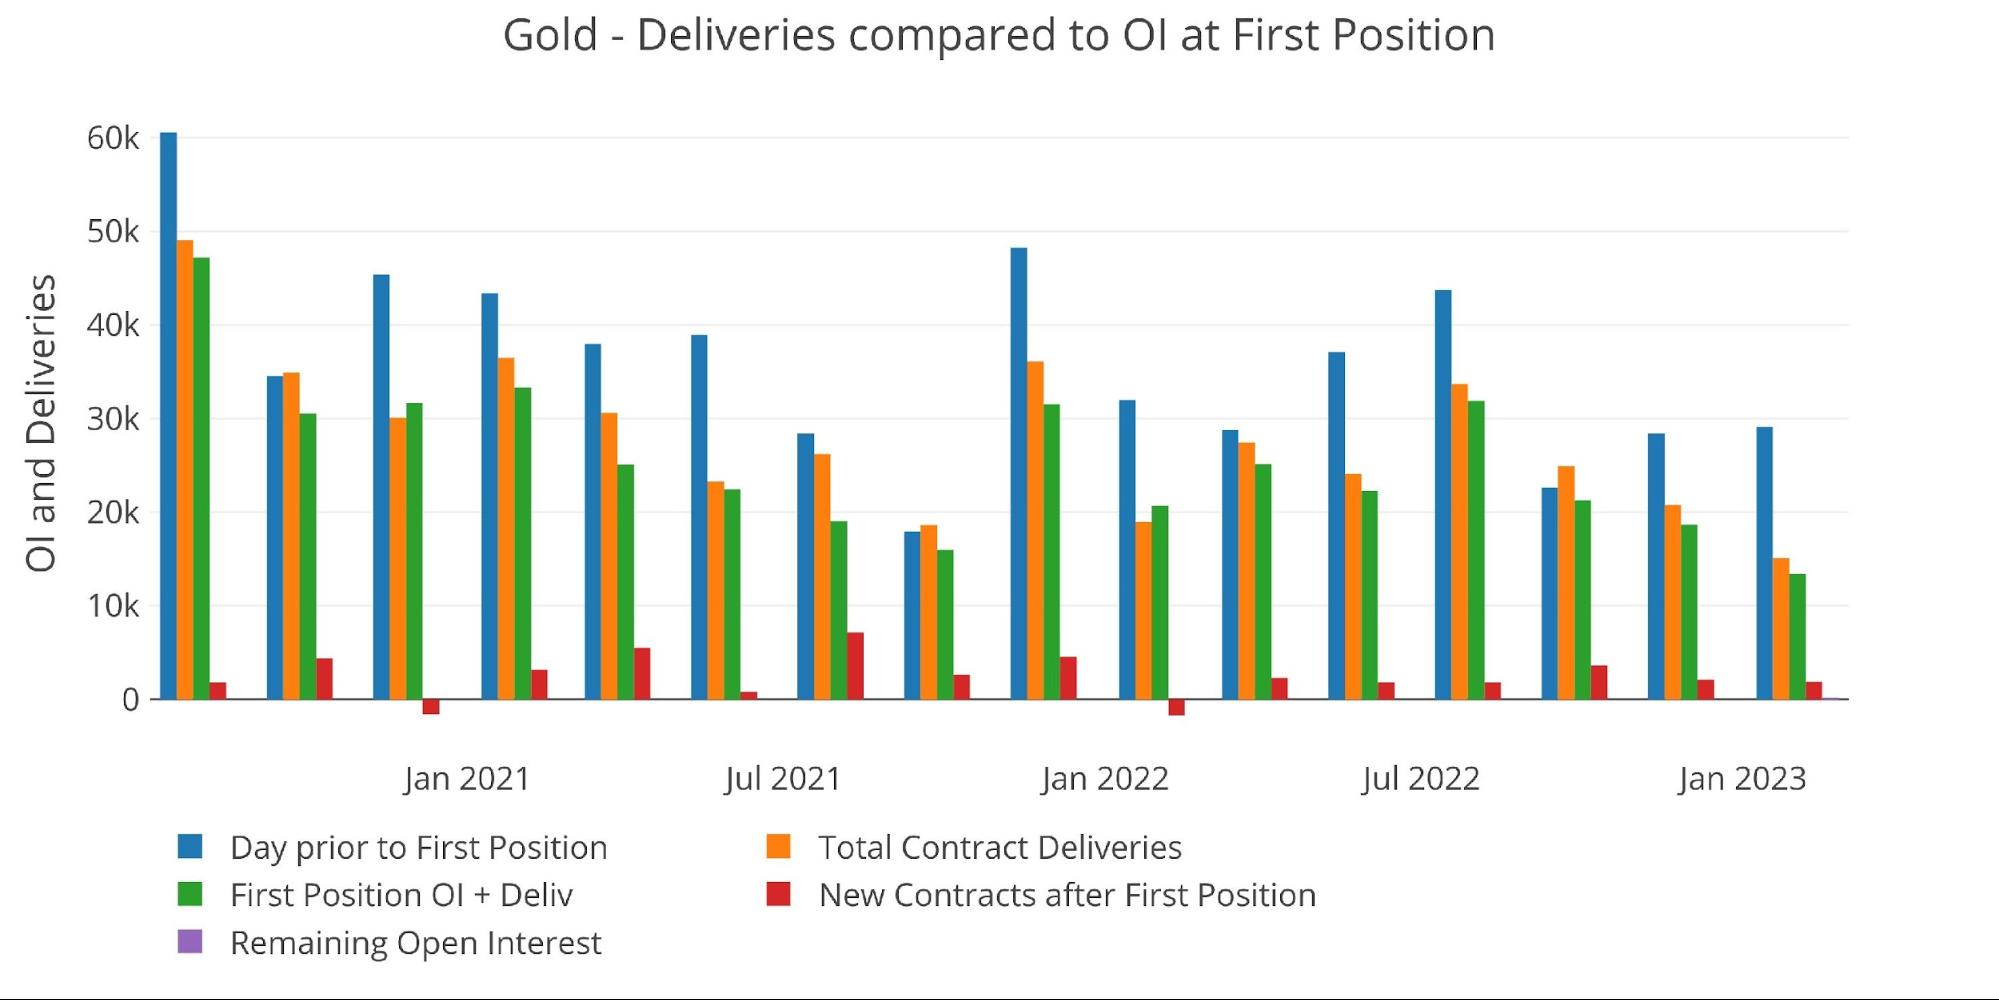
Figure: 2 24-month delivery and first notice
February did see a healthy number of contracts open for immediate delivery. Around 2000 has been the norm, and this month was no different.
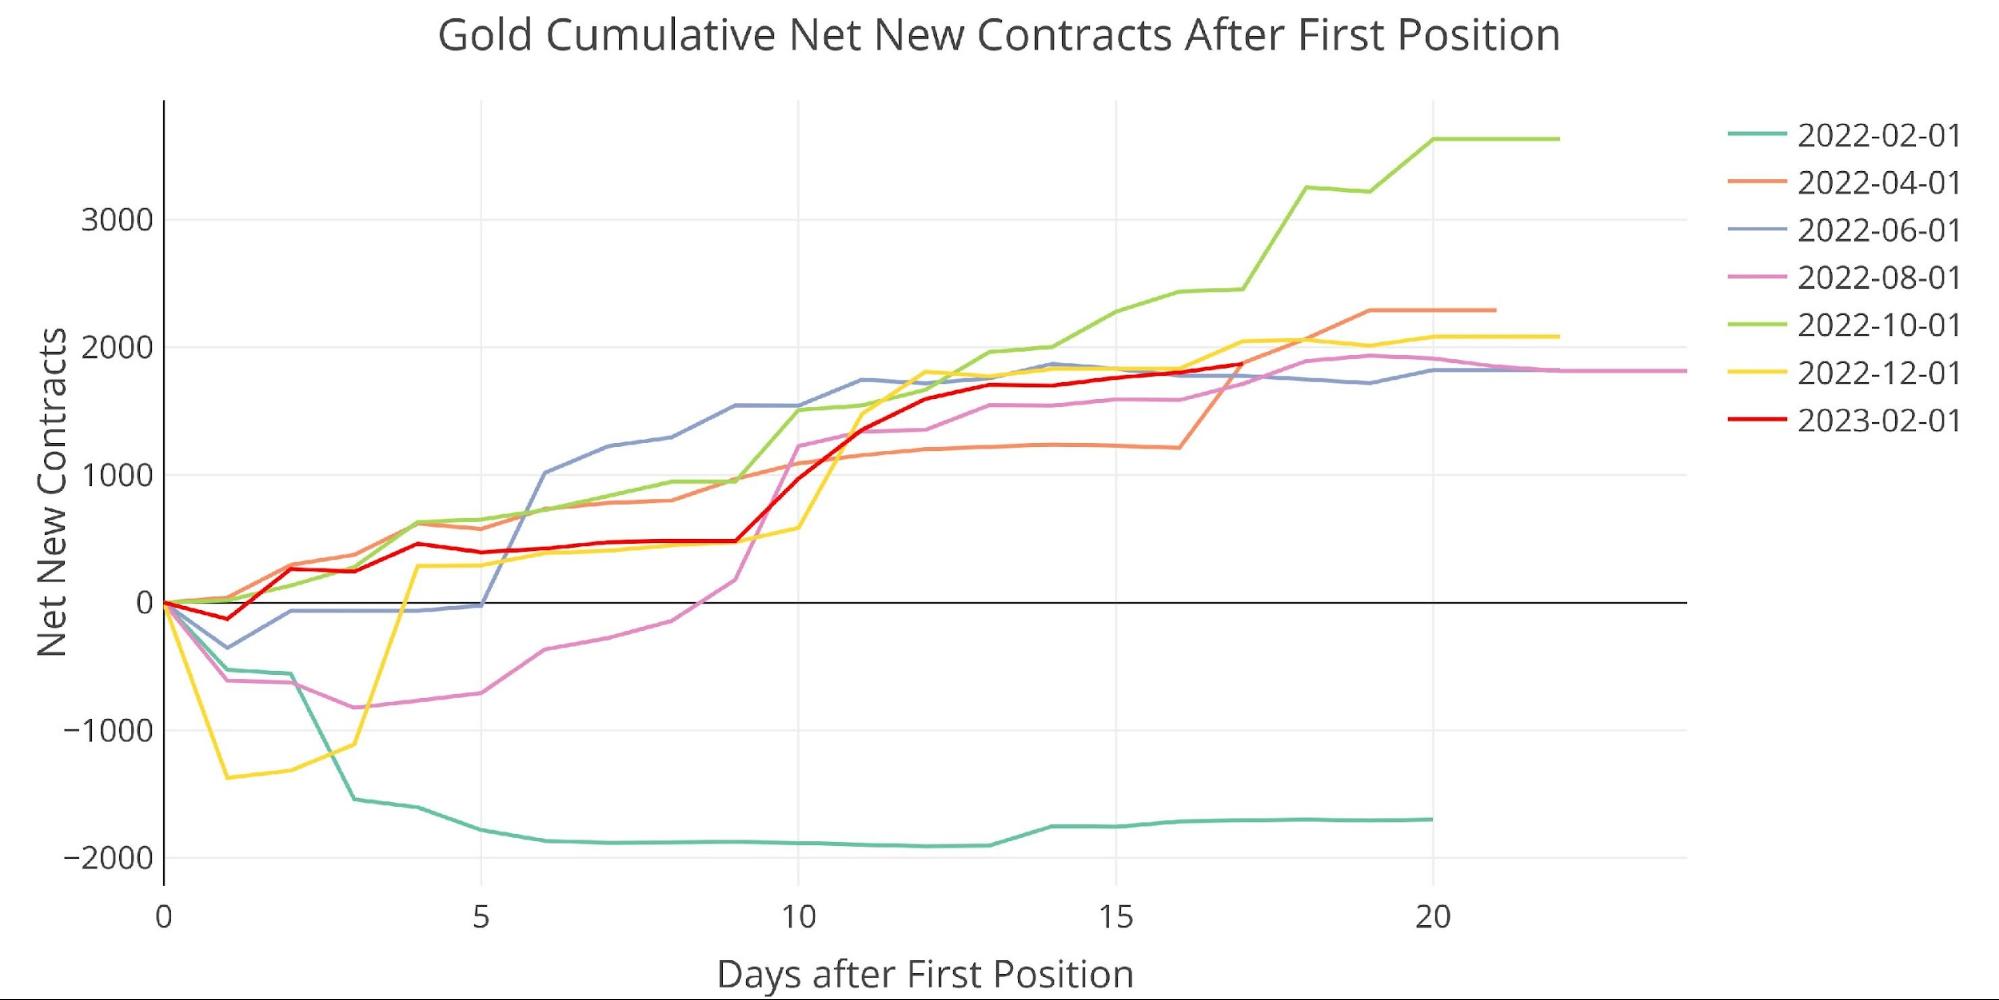
Figure: 3 Cumulative Net New Contracts
This will be the weakest February in three years from a notional amount. Total deliveries will come in at around $3B.
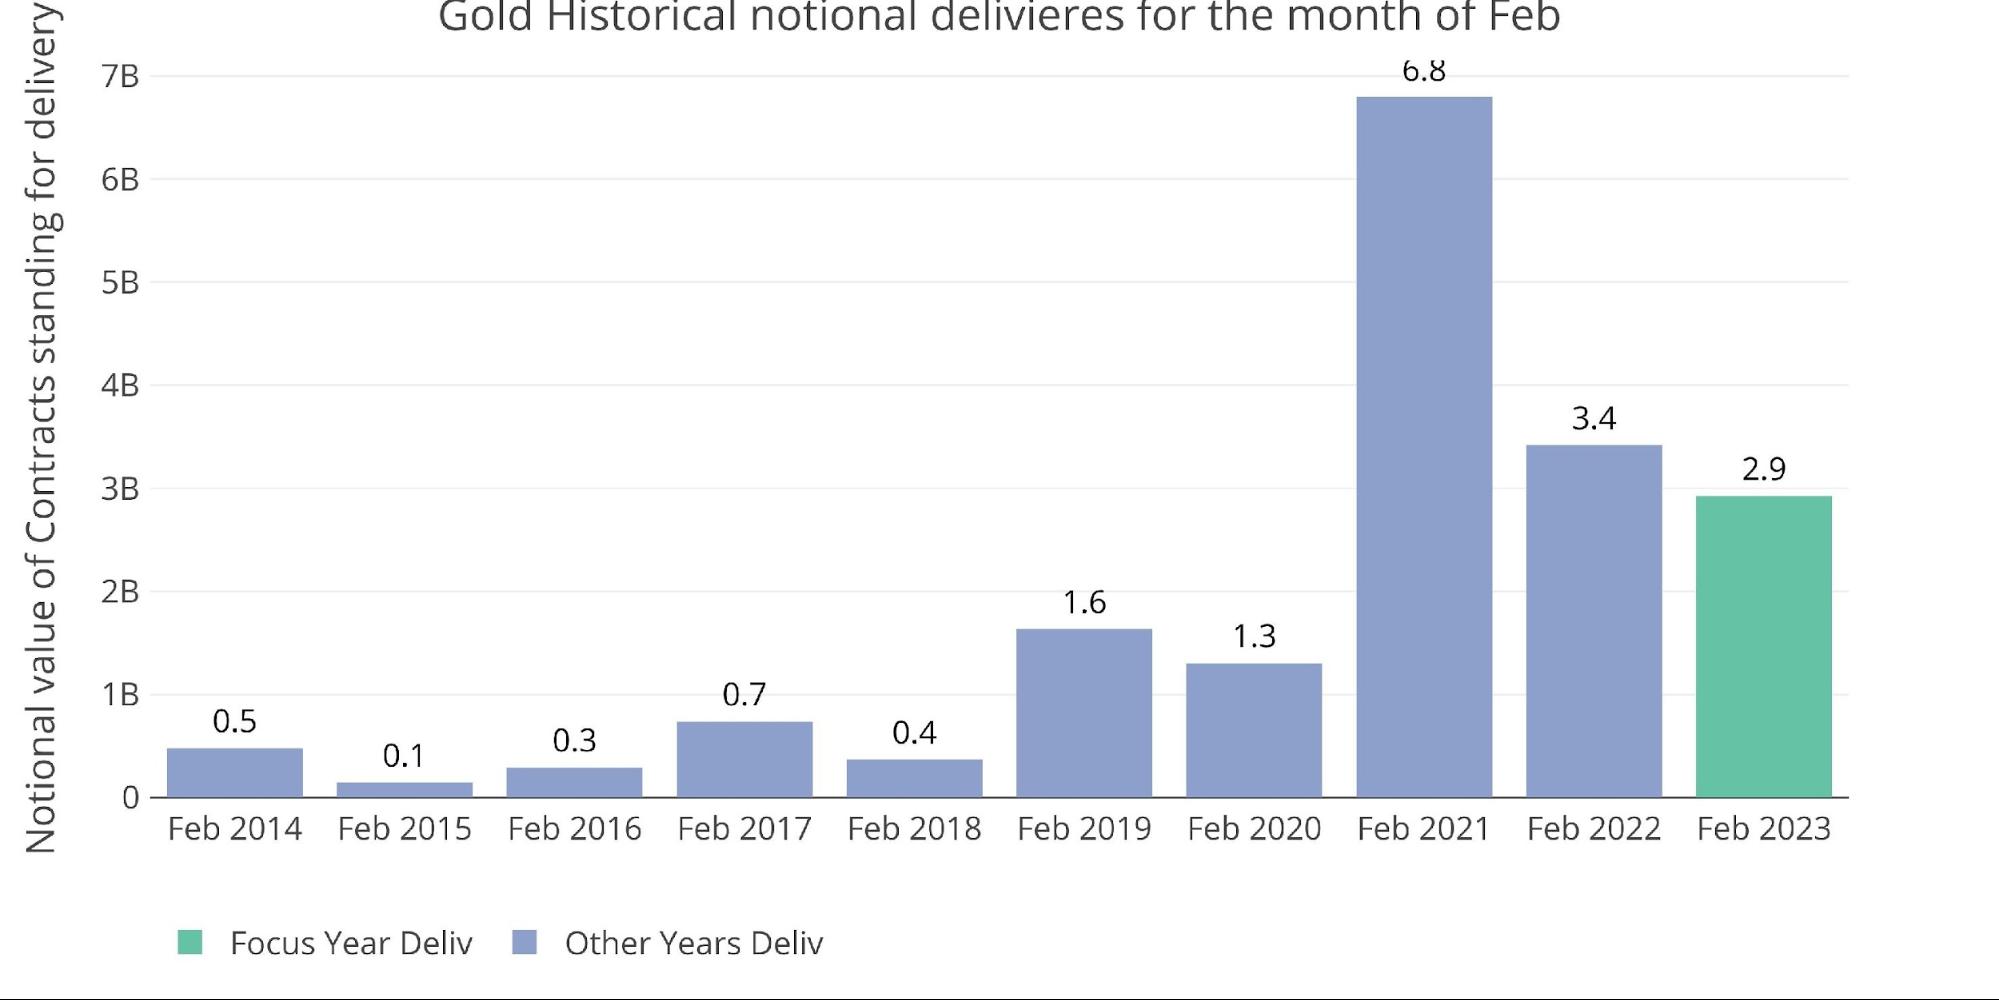
Figure: 4 Notional Deliveries
BofA was back in the market, restocking its inventory. As has been the case, they seem to love buying when prices are high (prices were above $1900 in early Feb), and then delivering out metal when prices fall. This has been quite unprofitable for BofA, as they are consistently buying high and selling low. A better explanation is that they are the backstop to give confidence to the gold market. In this case, some trading losses mean little if it shores up confidence in the gold market. A loss of confidence would lead to massive losses for anyone holding short paper contracts!
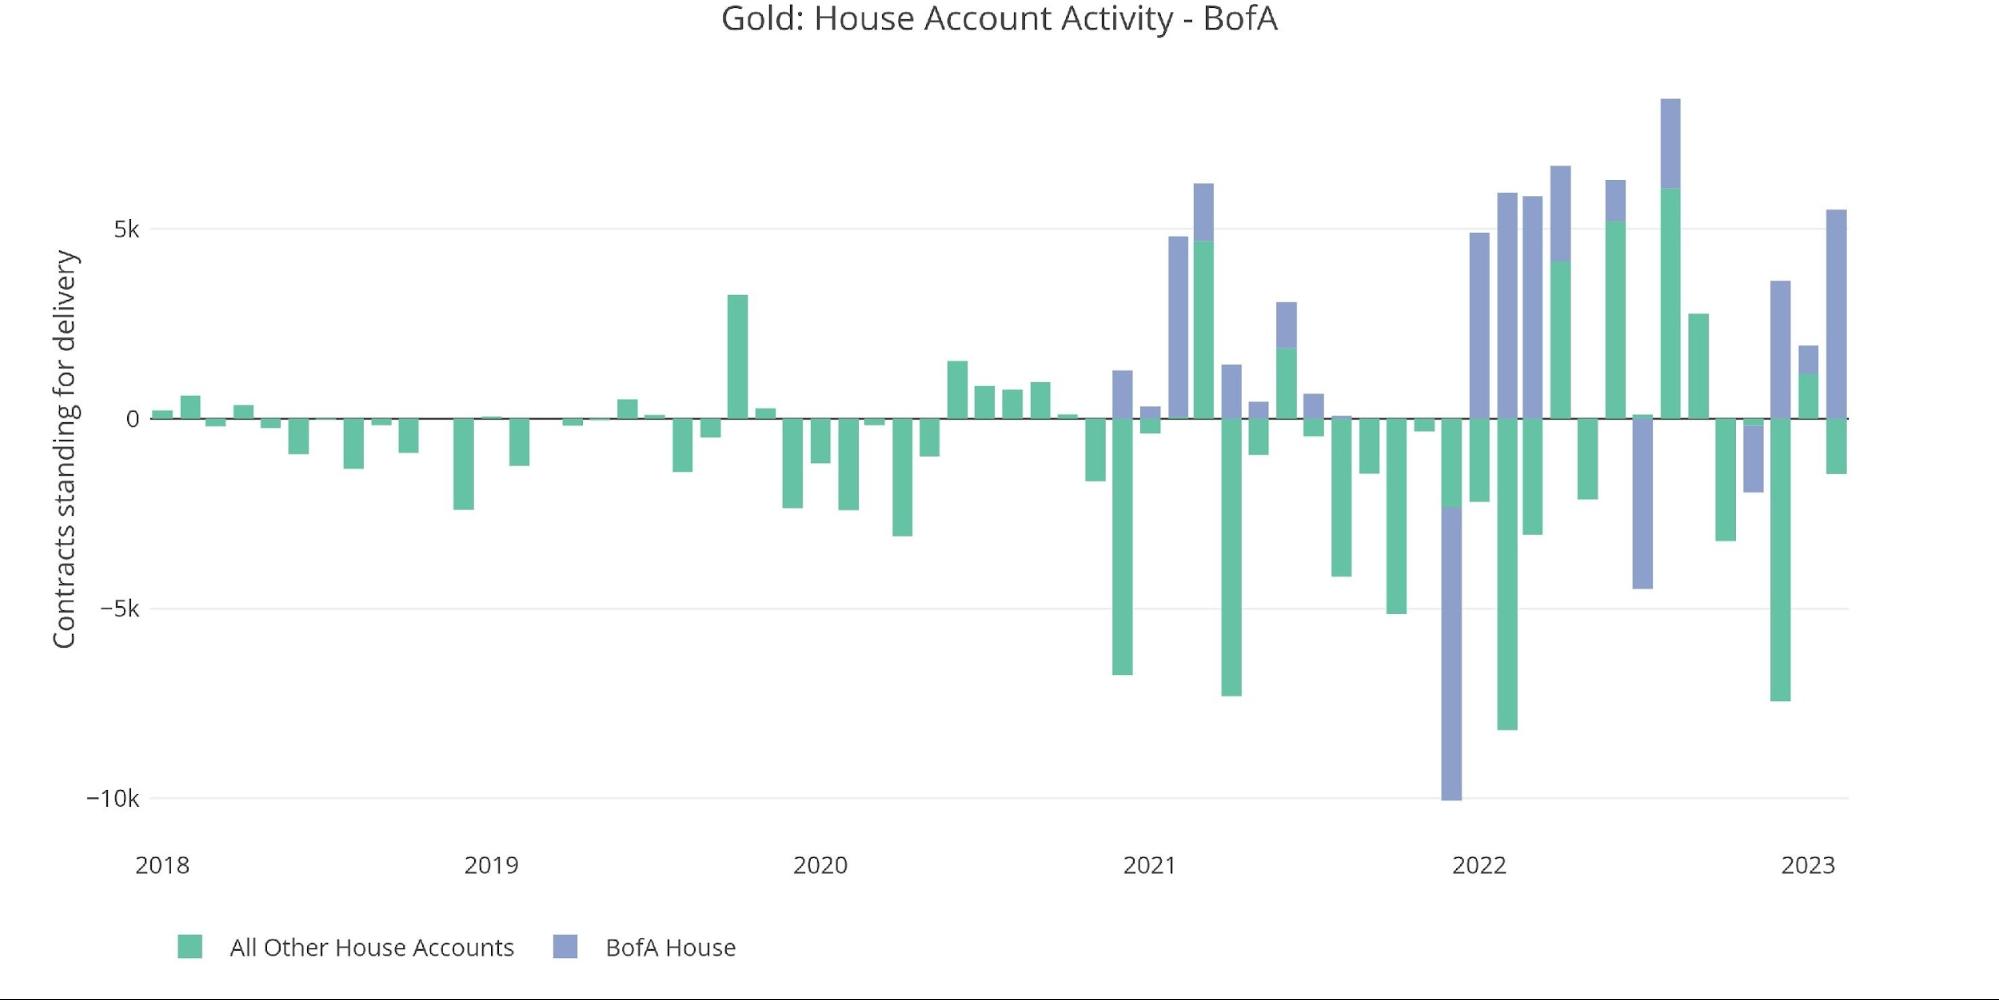
Figure: 5 House Account Activity
As noted in the recent stock report, physical metal continues to leave the Comex vaults at a steady pace.

Figure: 6 Recent Monthly Stock Change
Gold: Next Delivery Month
Jumping ahead to March shows moderate strength. Open interest is even picking up into First Notice which is a good sign.

Figure: 7 Open Interest Countdown
When looked at on a percentage basis relative to Registered, March is trending in line with some of the bigger minor months.
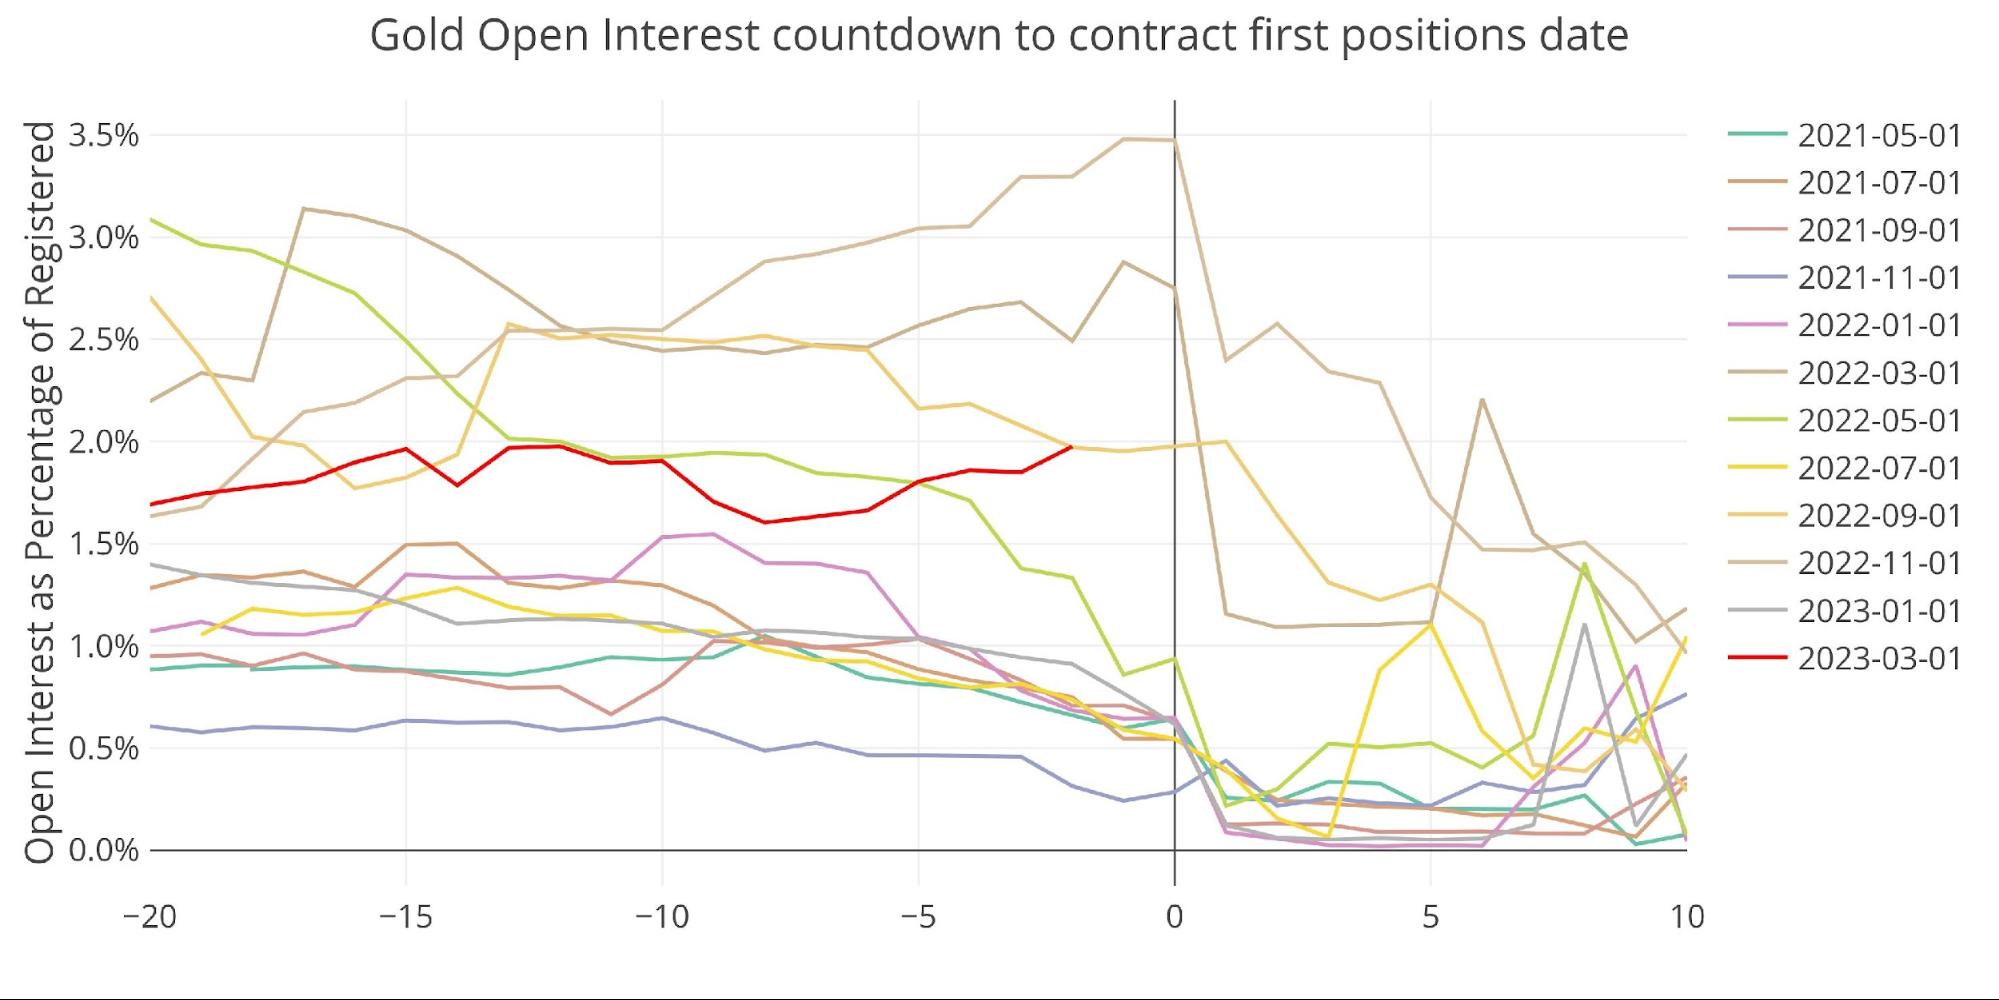
Figure: 8 Countdown Percent
Unlike the major months, minor months have actually seen an upward swing in delivery volume over the last 18 months.
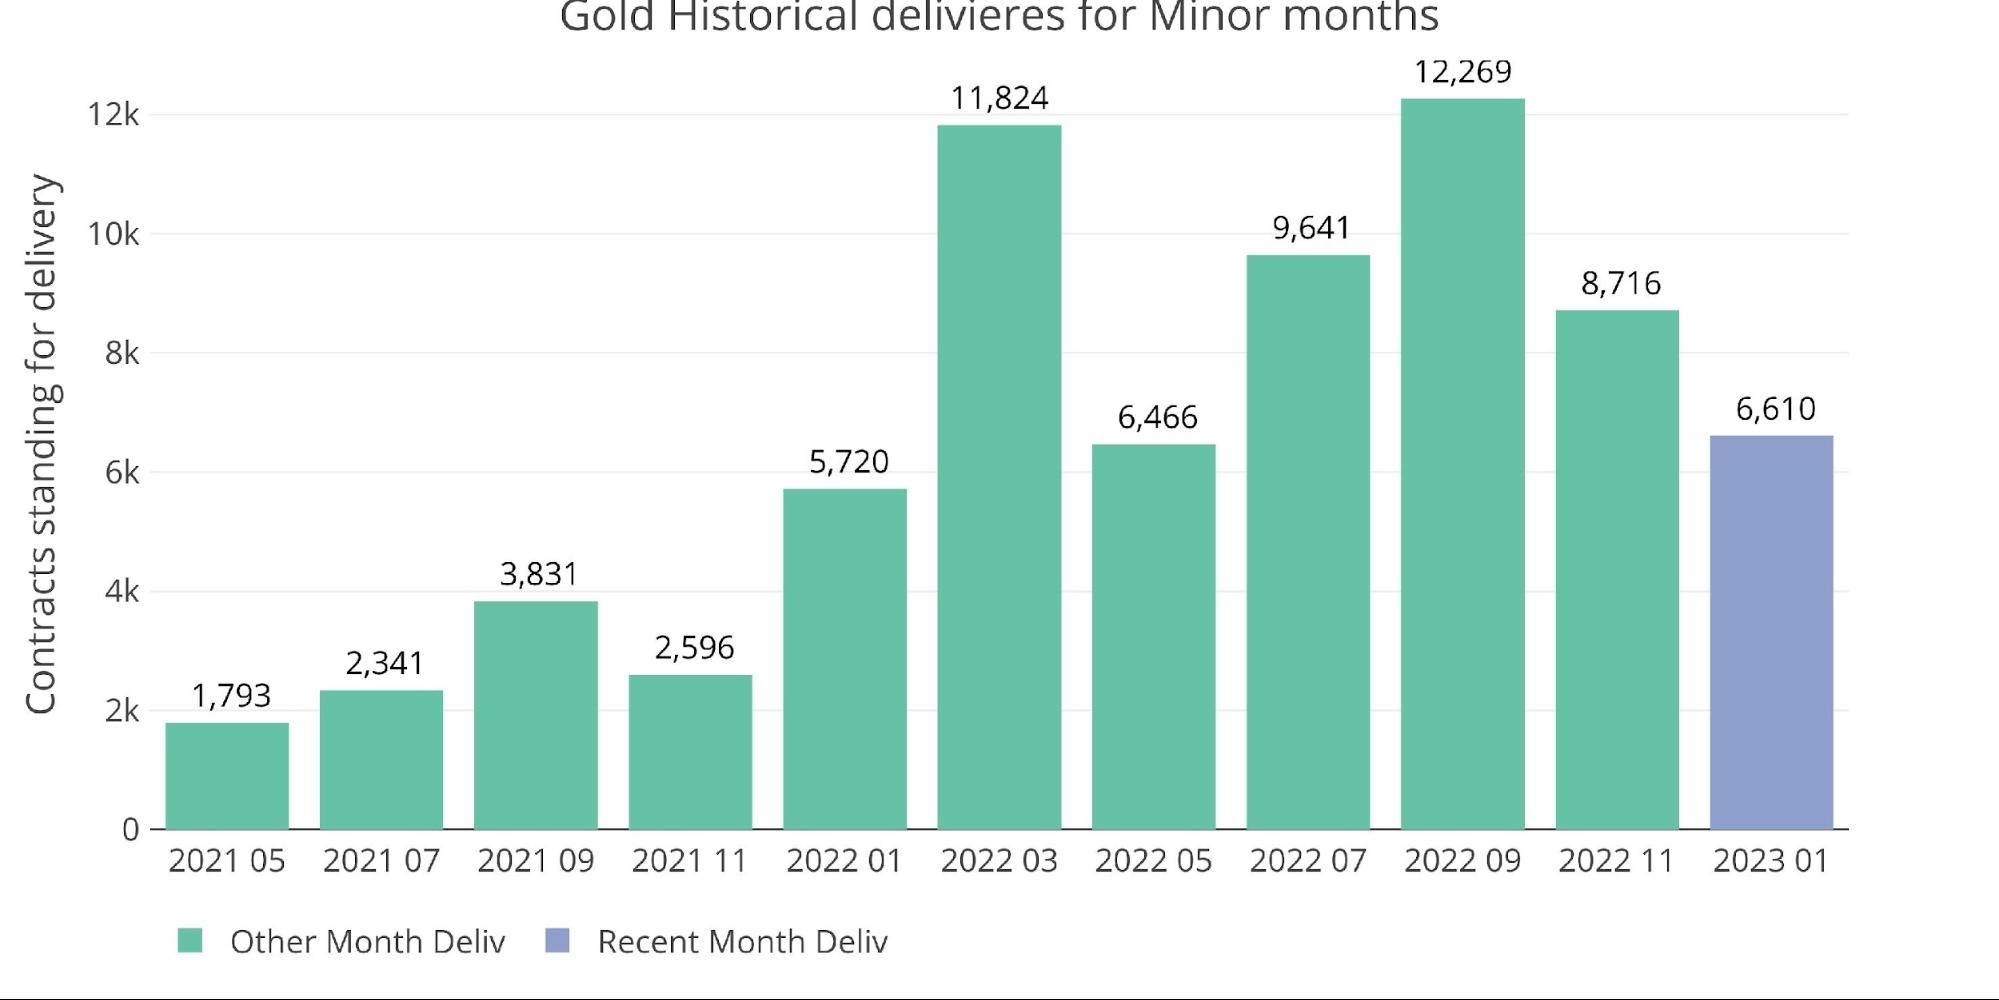
Figure: 9 Historical Deliveries
Spreads
The market remains in strong contango with the highest spreads seen since at least summer 2021.
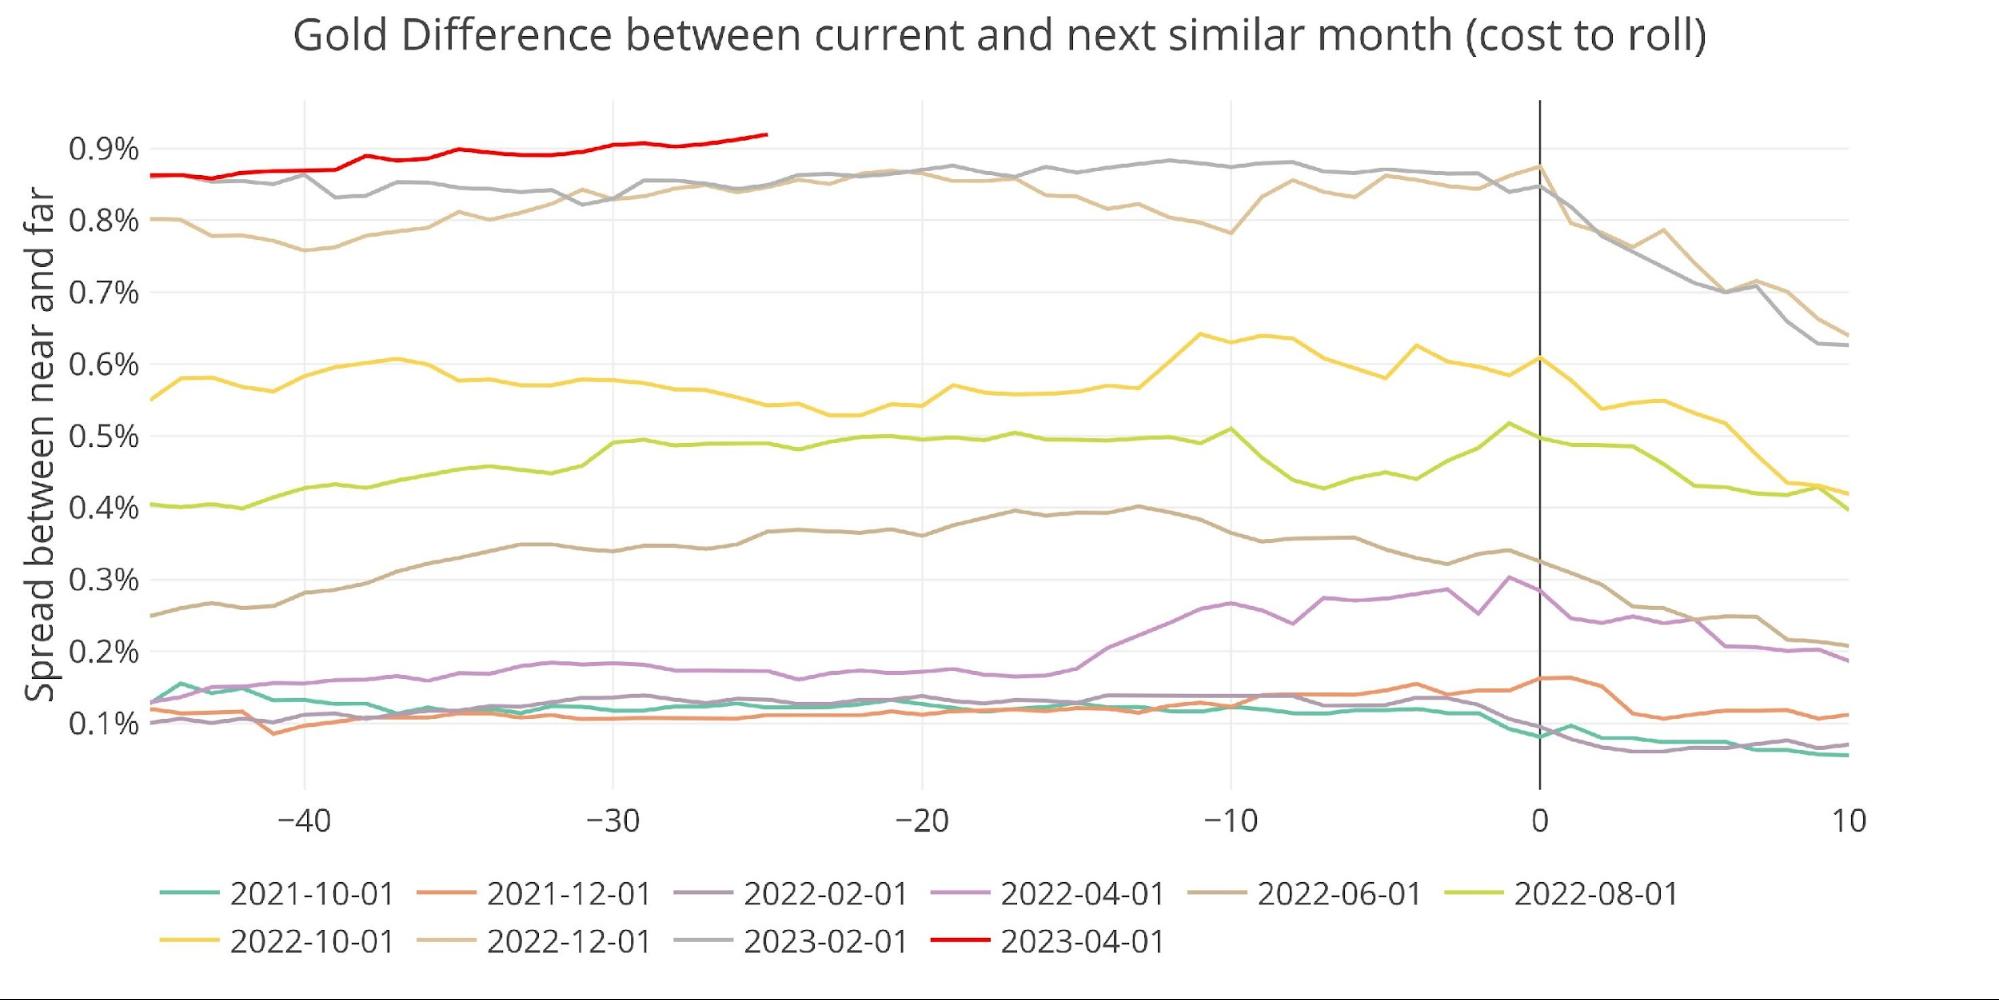
Figure: 10 Futures Spreads
The spread in the cash market looks like it has become very controlled and tightly managed. This started around October 2020 right after gold reached new all-time highs. The nature of the spread in the cash market looks quite deliberate.
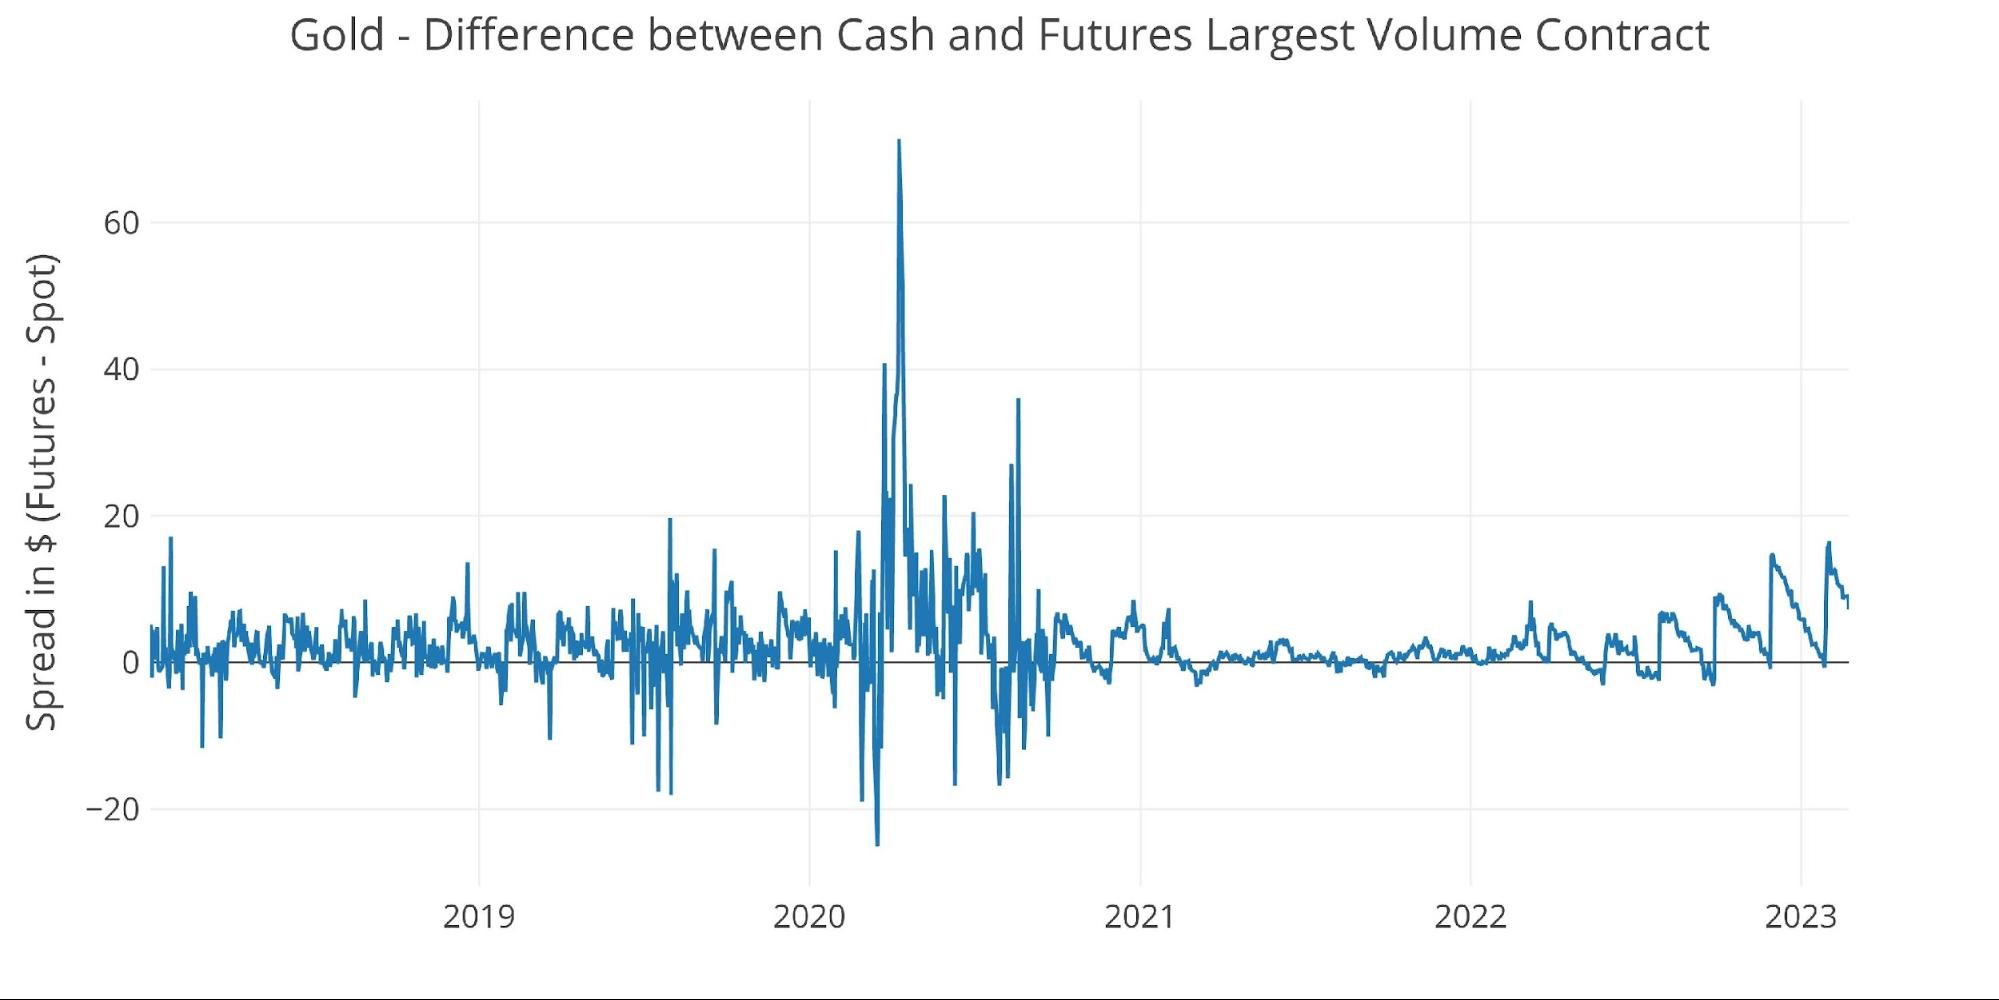
Figure: 11 Spot vs Futures
Silver: Recent Delivery Month
Silver delivery volume saw a modest delivery volume that exceeded both October and November but fell short of January.
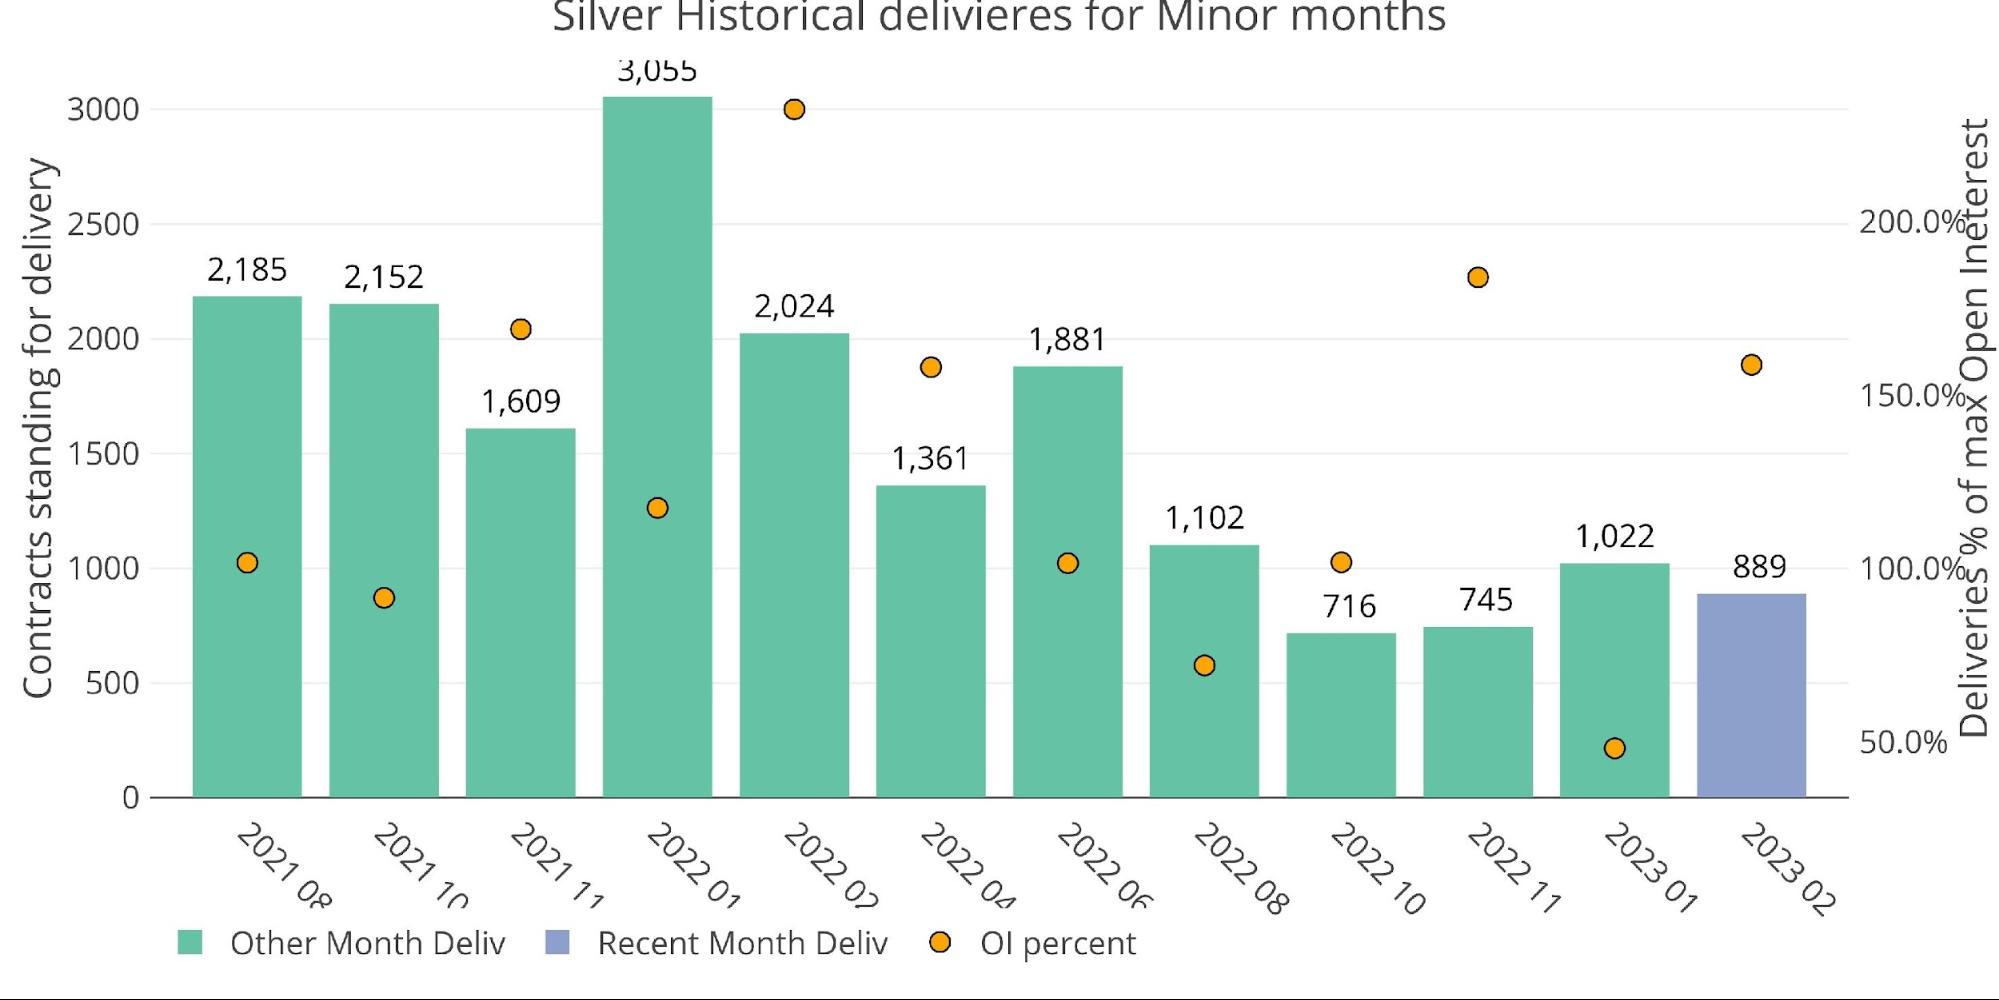
Figure: 12 Recent like-month delivery volume
This was driven almost entirely by net new contracts. Heading into the month, open interest was approaching zero! Net new contracts (red bar) then came in the highest since last February, when the war in Ukraine had started and silver saw a soft default overnight with a massive adjustment to open interest.
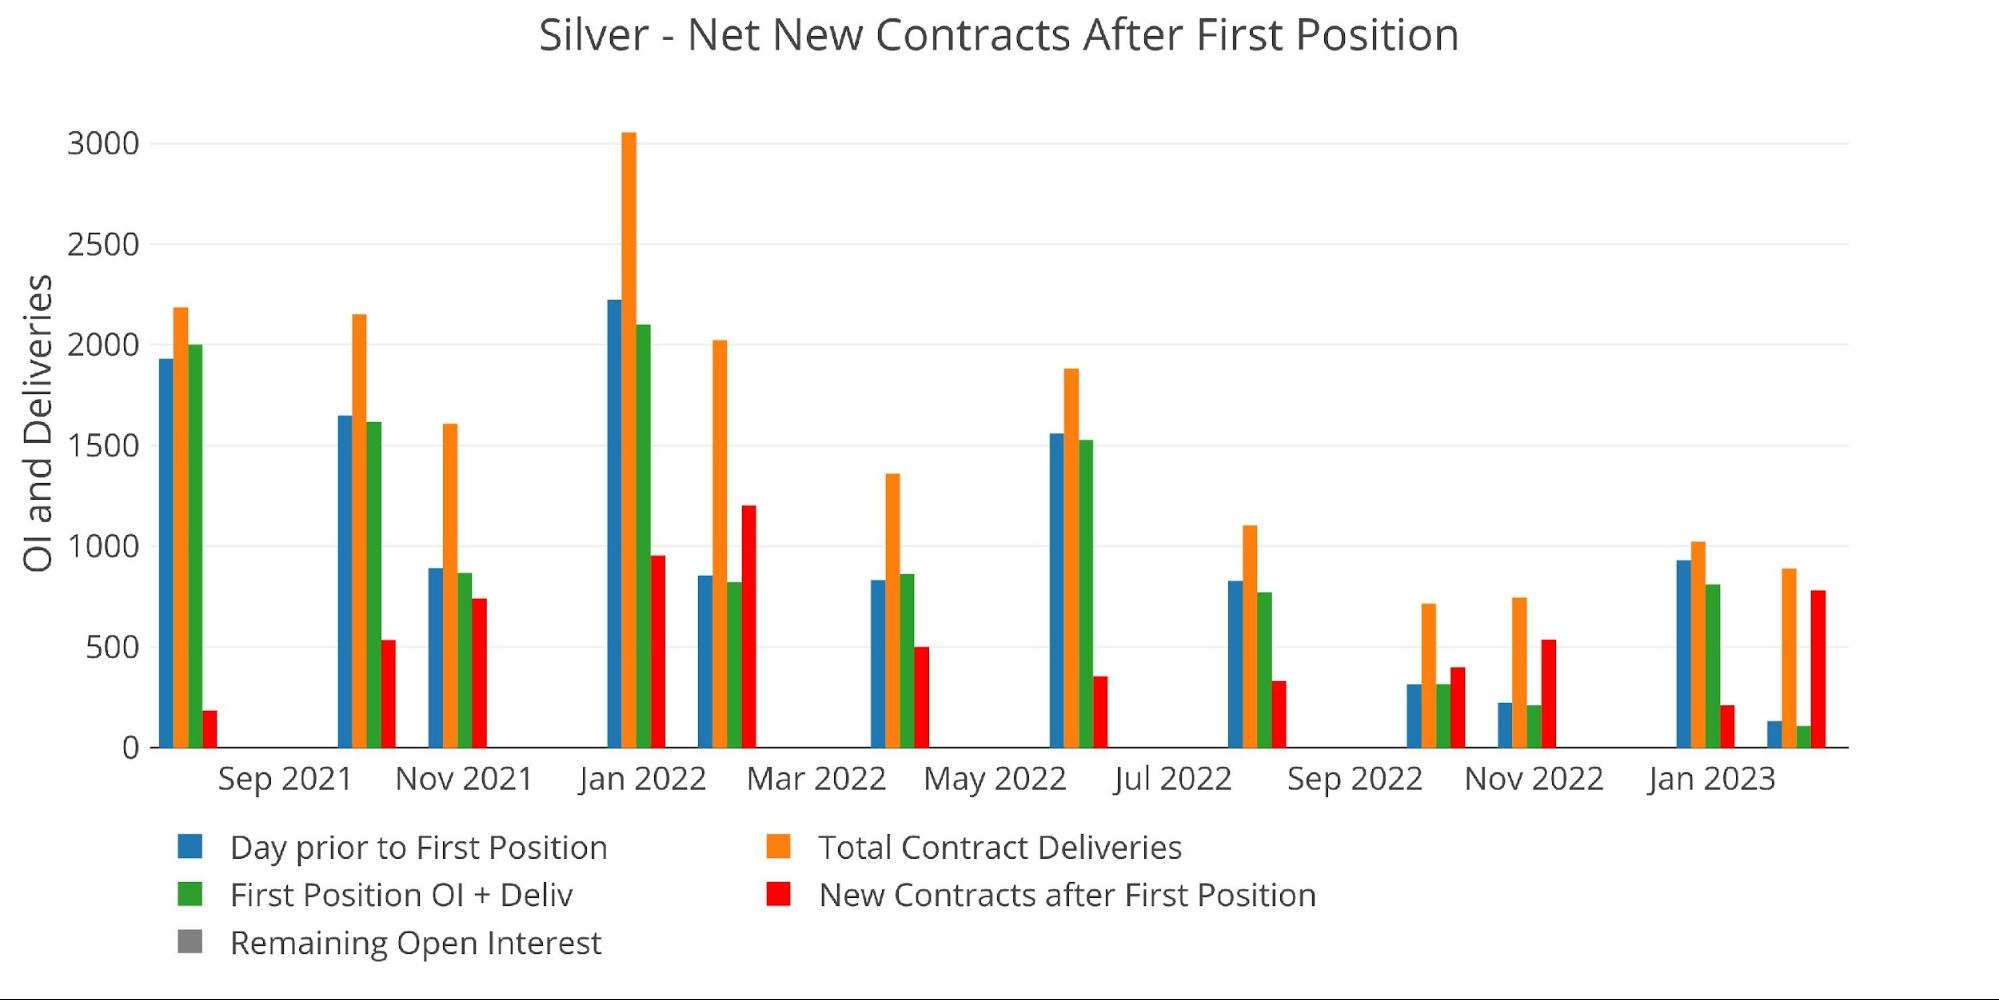
Figure: 13 24-month delivery and first notice
The surge in net new contracts can be seen below. It happened in a single move.

Figure: 14 Cumulative Net New Contracts
The bank house account activity shows that BofA may have been the player behind the move, accumulating 500 contracts worth of silver during February. They seem to still be restocking after having to backstop the market in September. At least this time they are buying at lower prices!
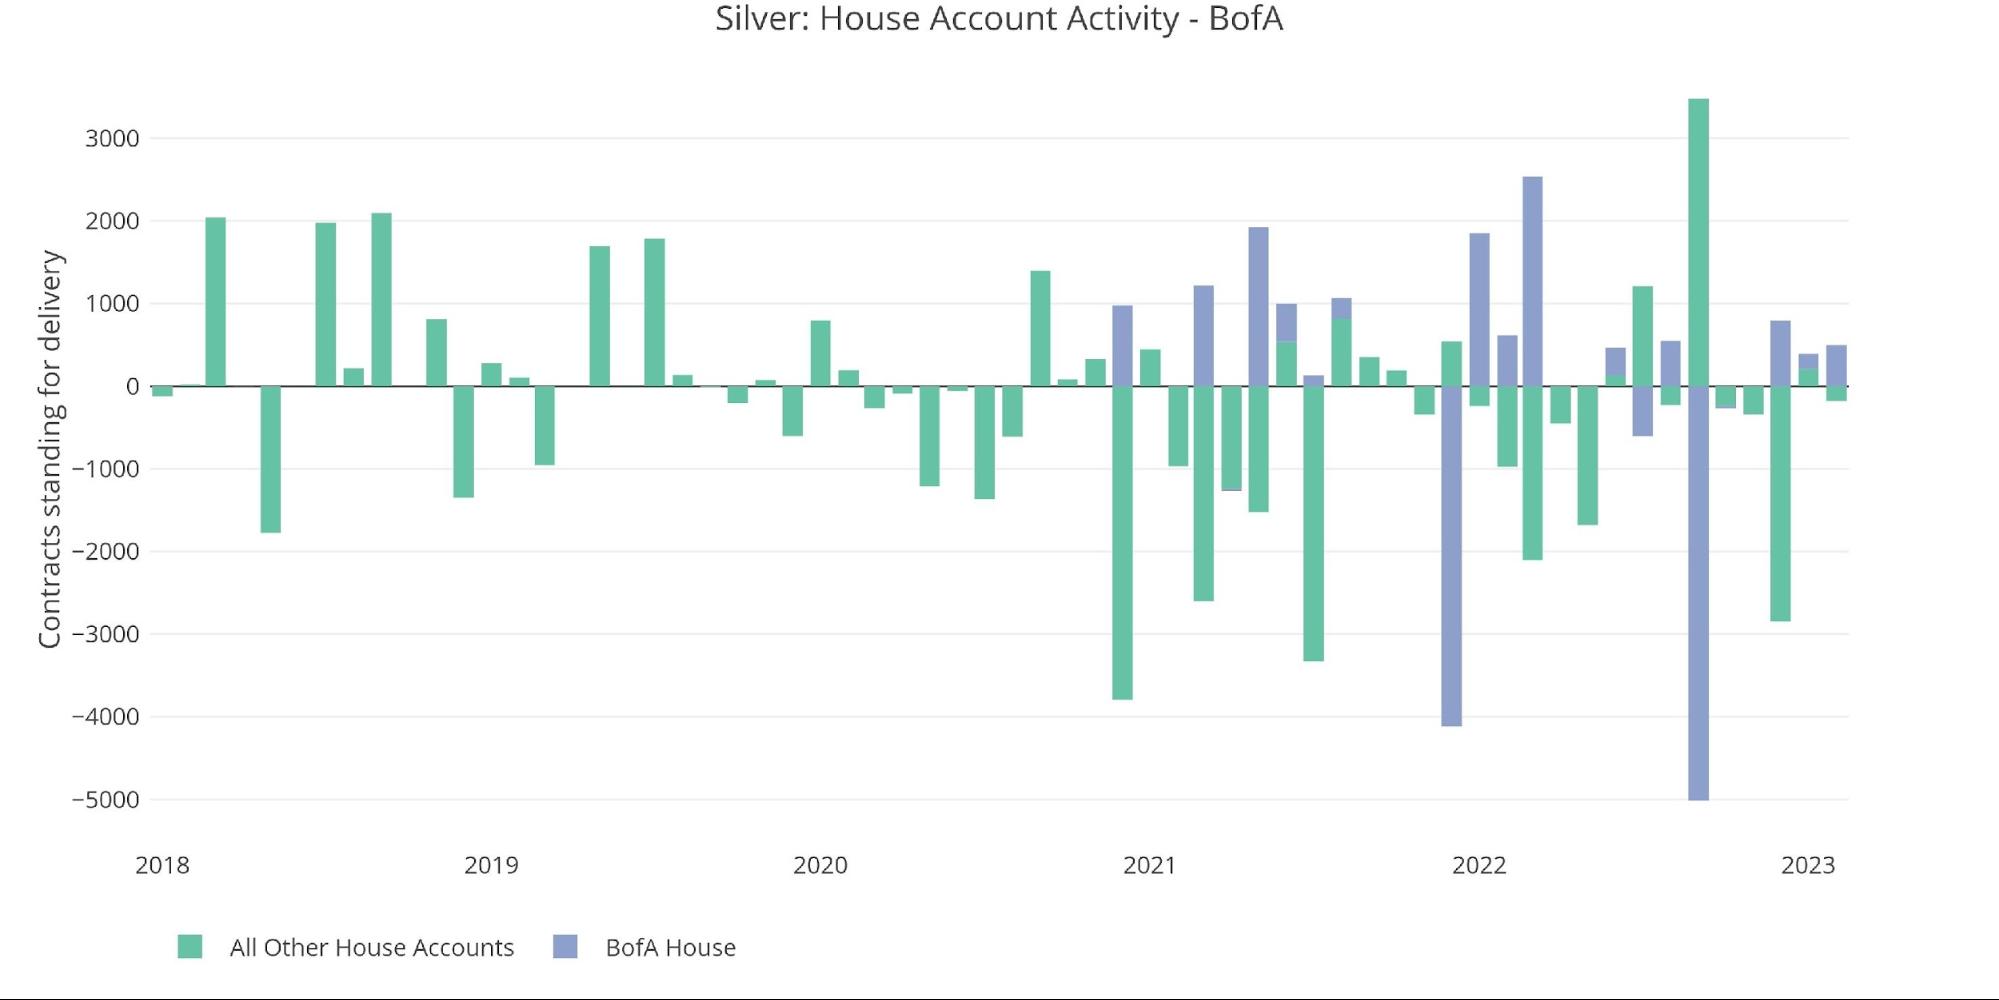
Figure: 15 House Account Activity
February will come in weak relative to the last two years, but above any February before Covid.
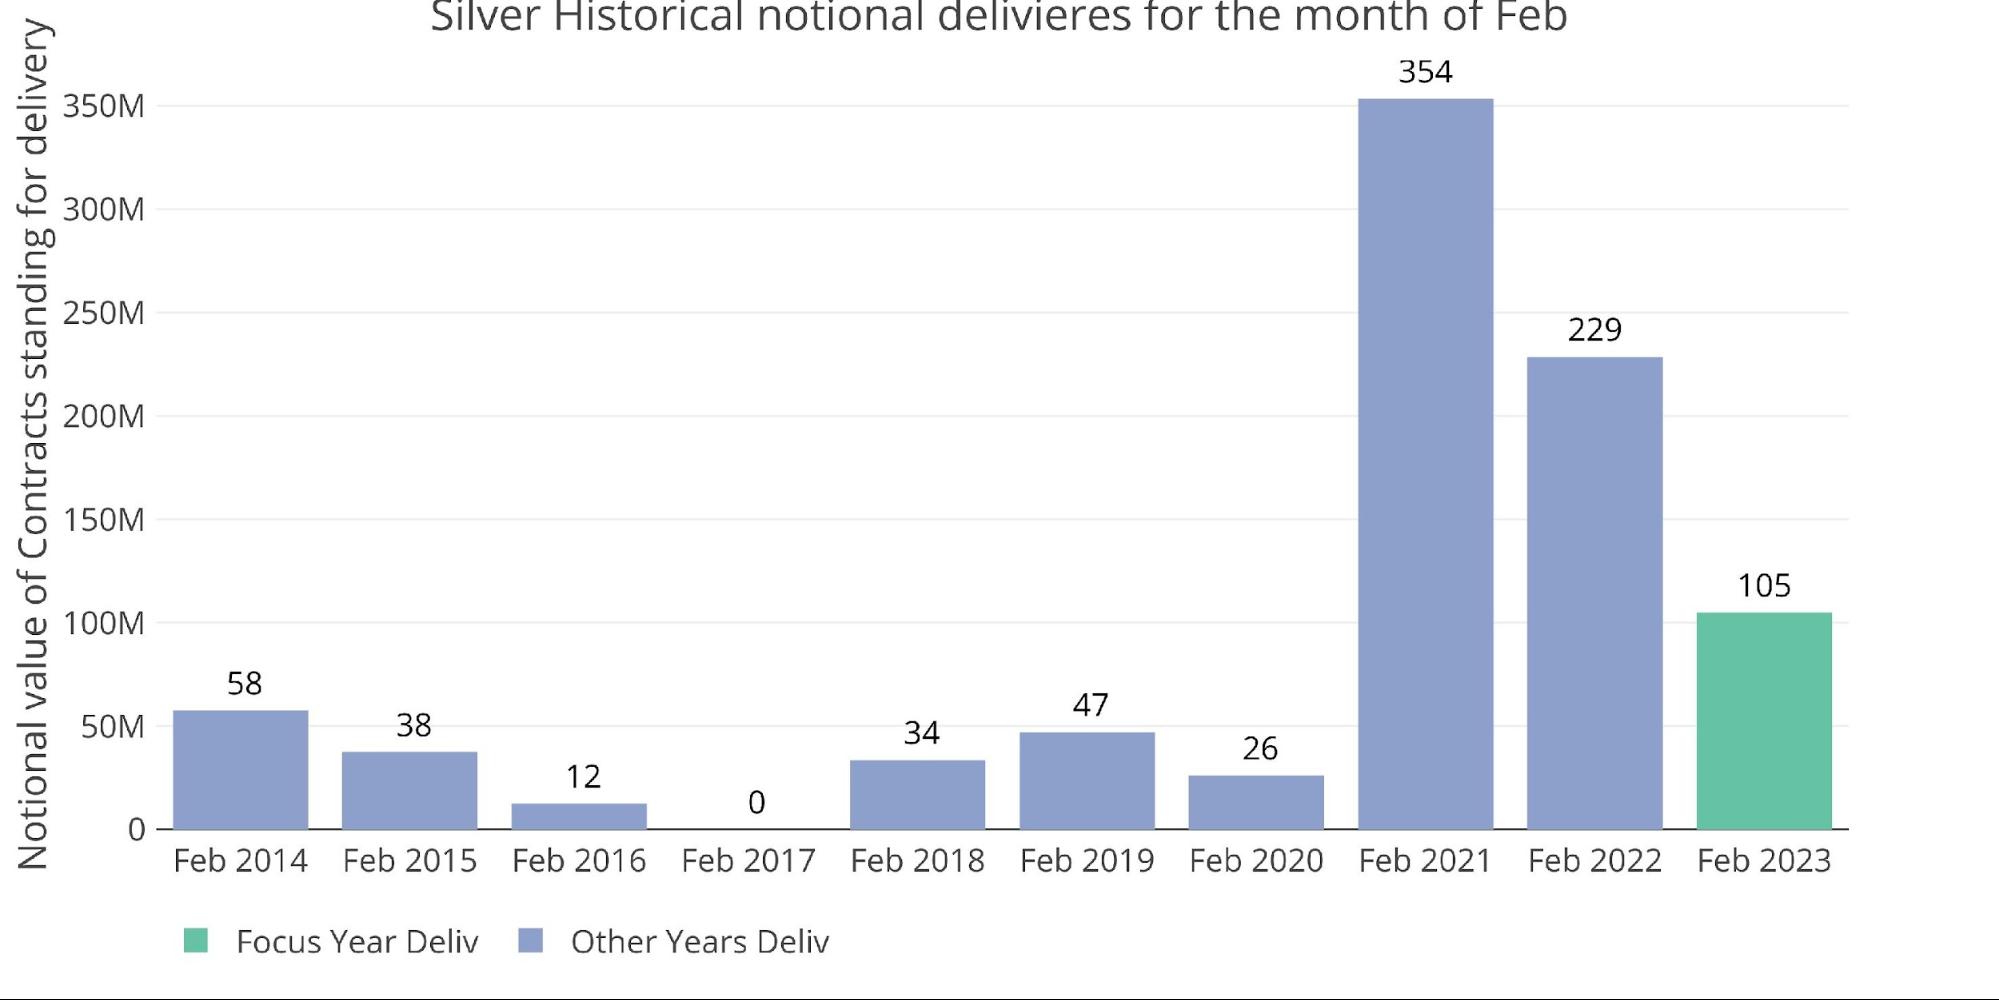
Figure: 16 Notional Deliveries
Perhaps the most interesting data point is the inventory report. Registered metal has completely flat-lined for the last two weeks. This happened last month as well. It seems the available inventory in Registered is finding a floor.
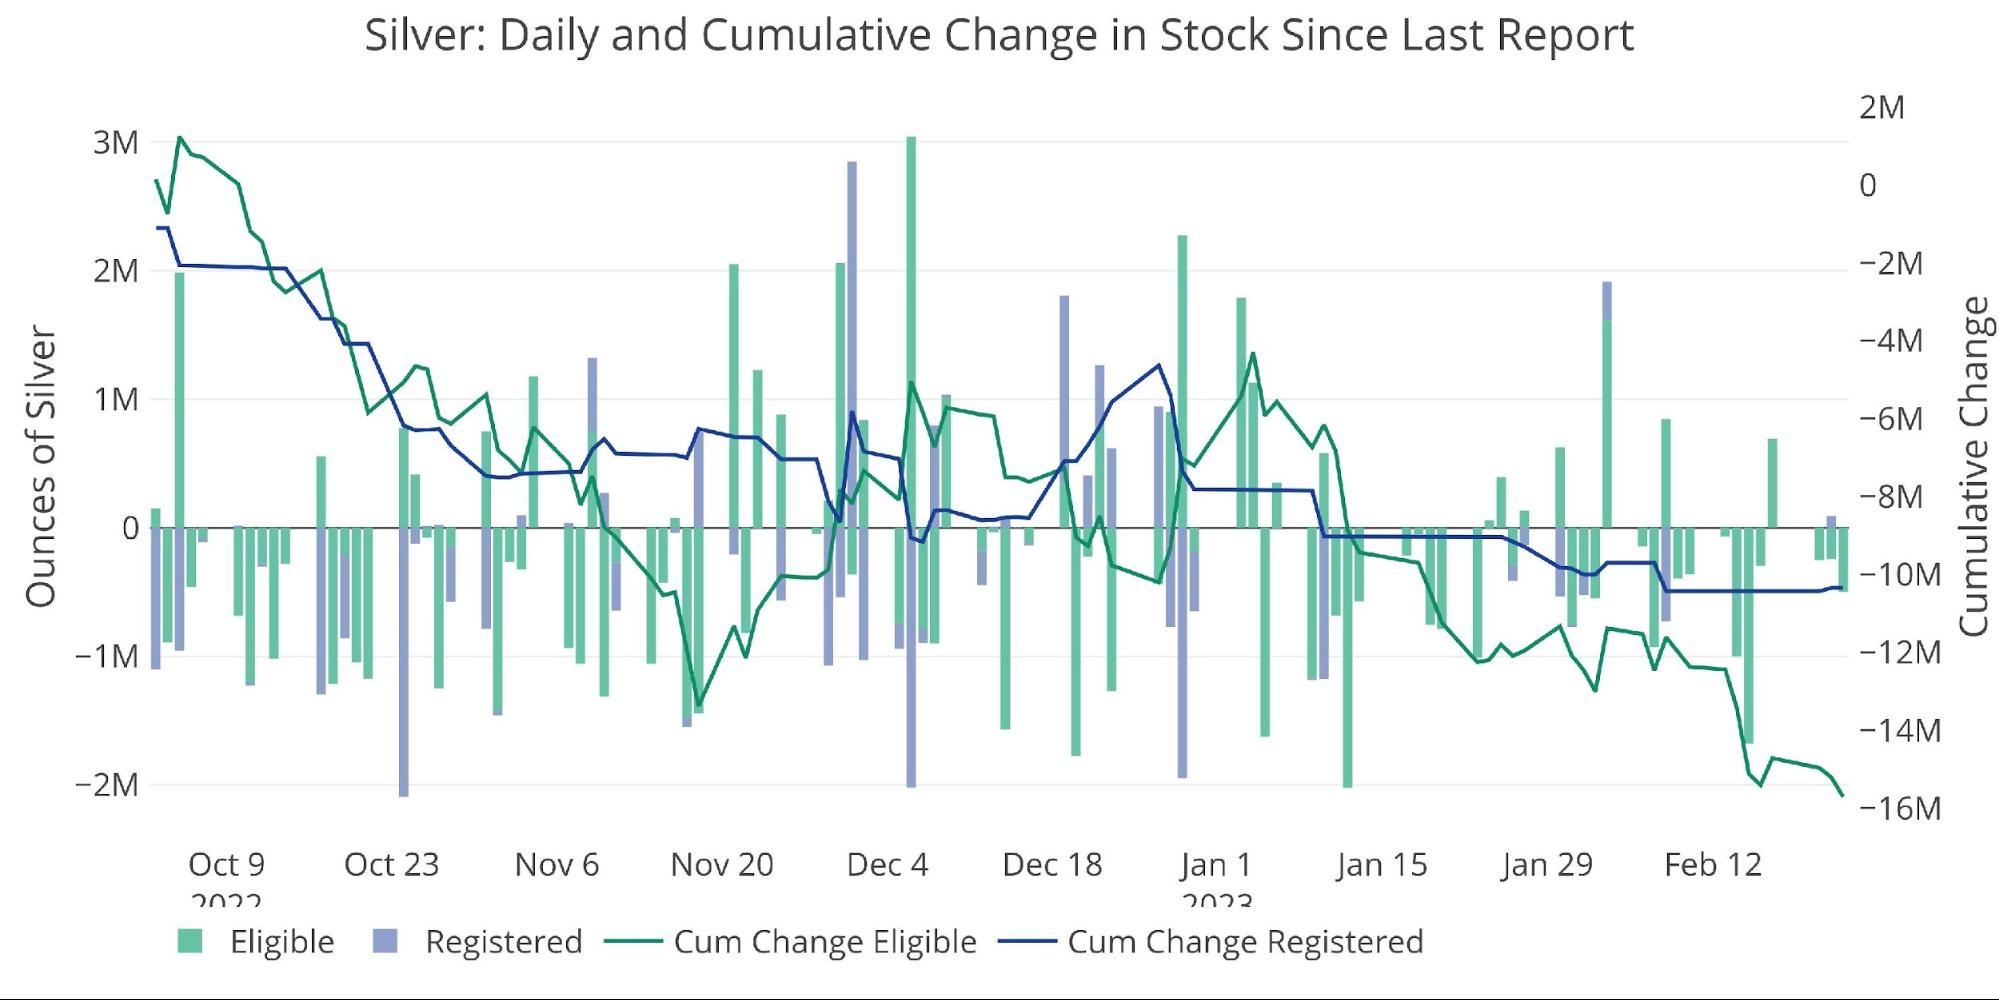
Figure: 17 Recent Monthly Stock Change
Silver: Next Delivery Month
March silver is a major month, and open interest is diving as usual into the close.
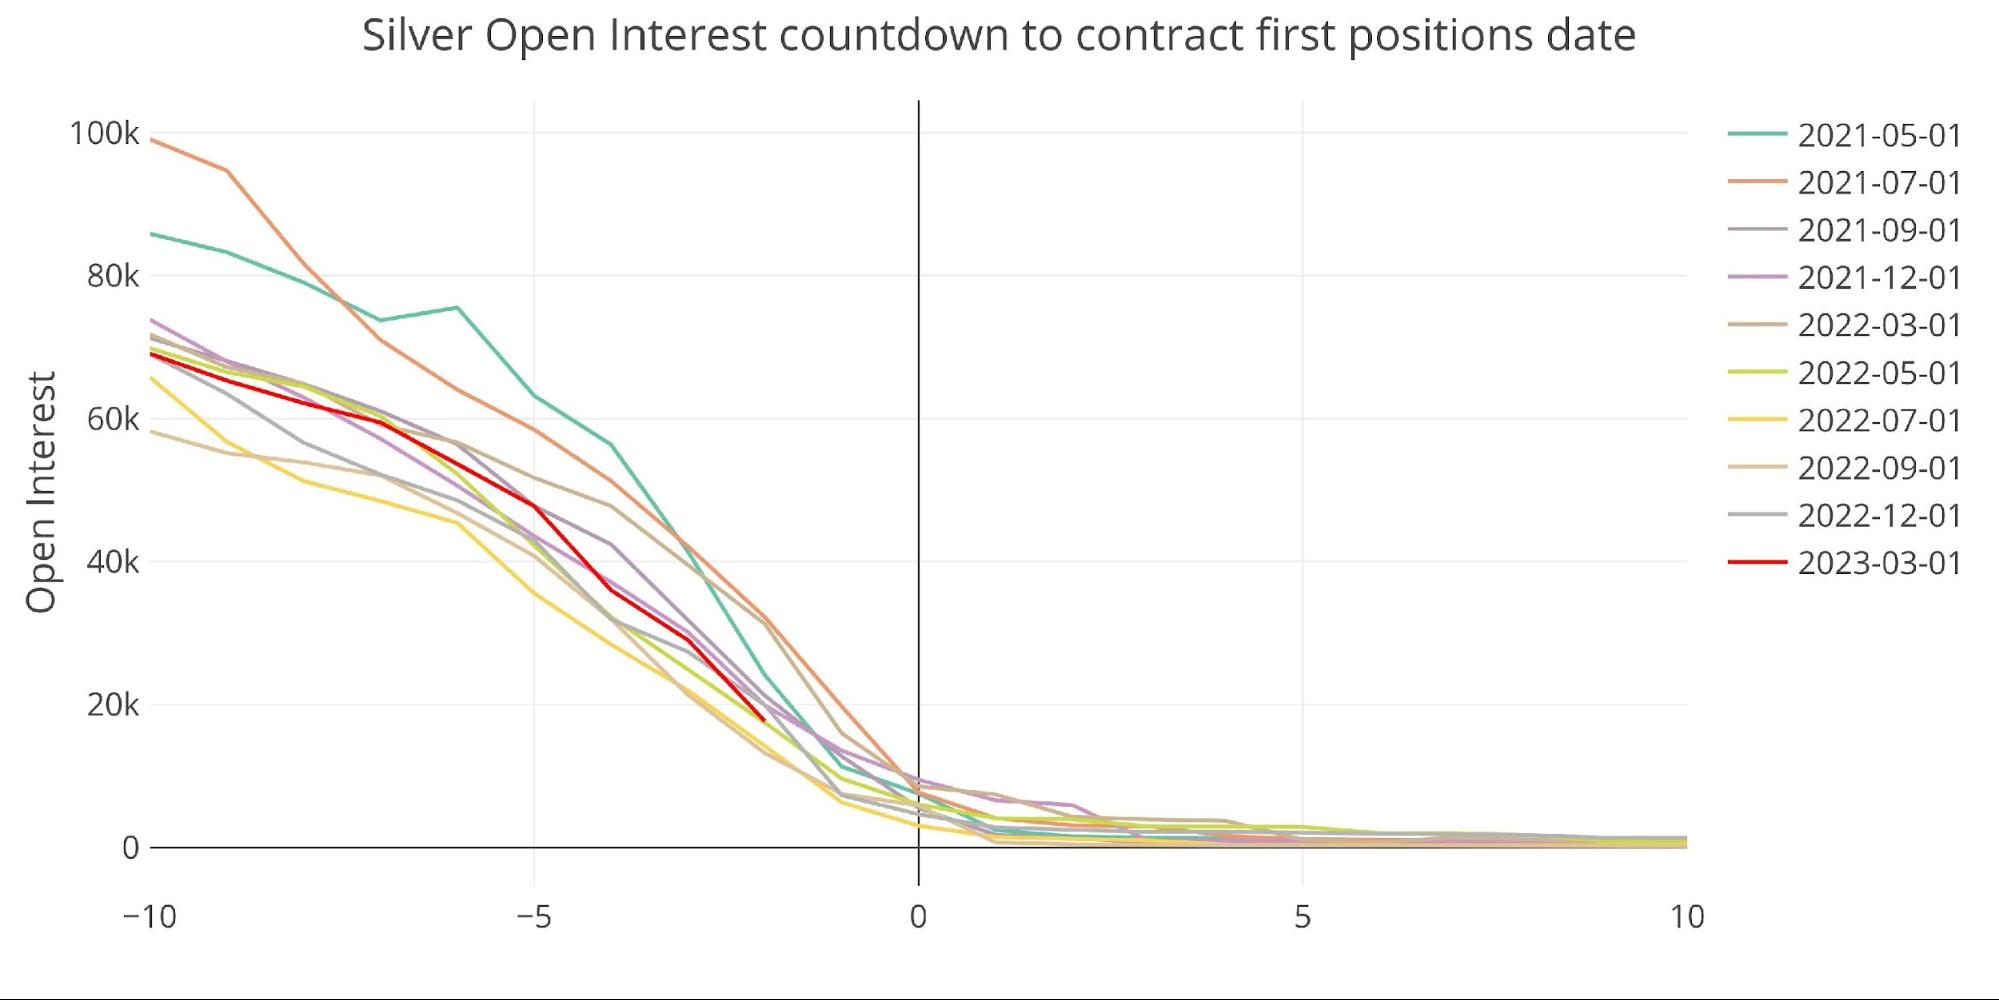
Figure: 18 Open Interest Countdown
When viewed as a percentage of registered, silver is still well above 100% with two days to go. At 277%, it sits below only December 2022 at this point which was at 283% at the same point. Expect open interest to fall below 100% of Registered… it has to!
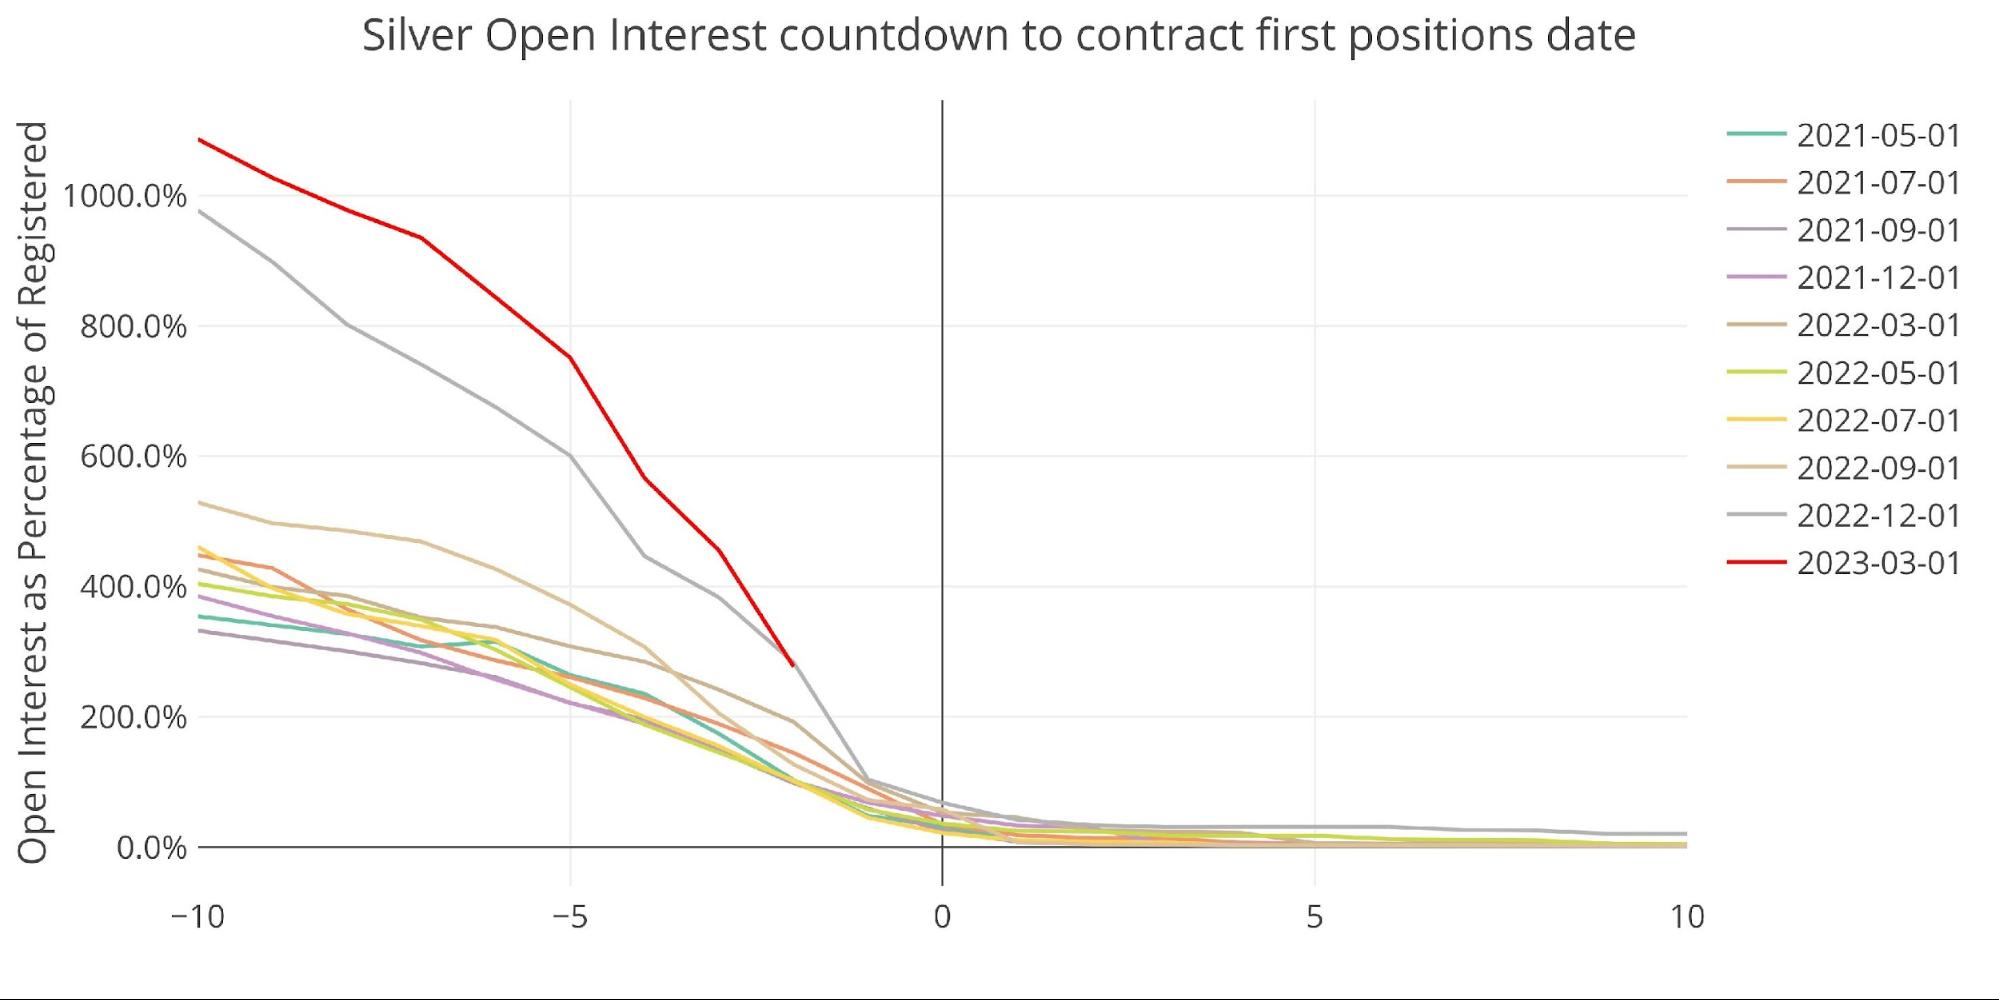
Figure: 19 Countdown Percent
Spreads
The silver futures market remains in contango…
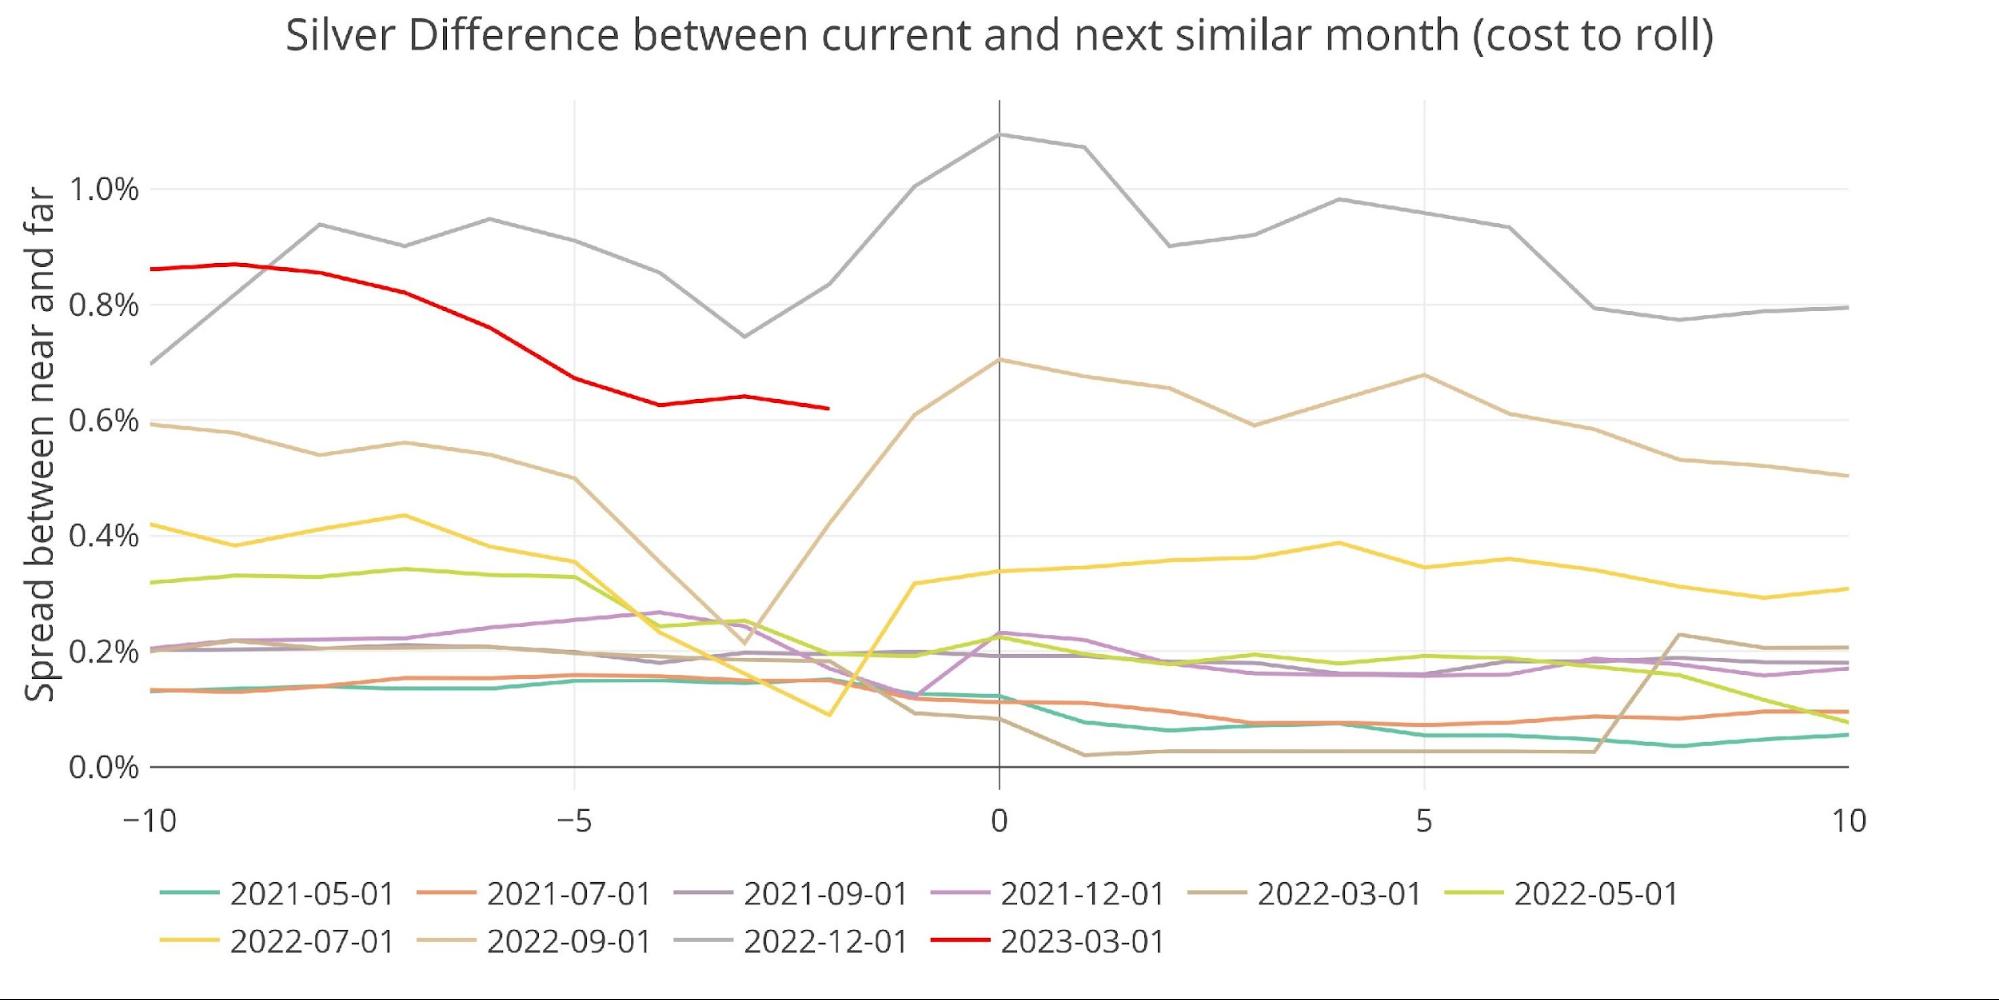
Figure: 20 Roll Cost
Even while the spot market briefly dipped back into backwardation.

Figure: 21 Spot vs Futures
Palladium
Palladium has not yet had its platinum moment, but it could be coming. Delivery volume is quite low in palladium, generally around the 200 mark for major months.

Figure: 22 Palladium Delivery Volume
Supplies of Comex inventory have been dwindling in recent months.
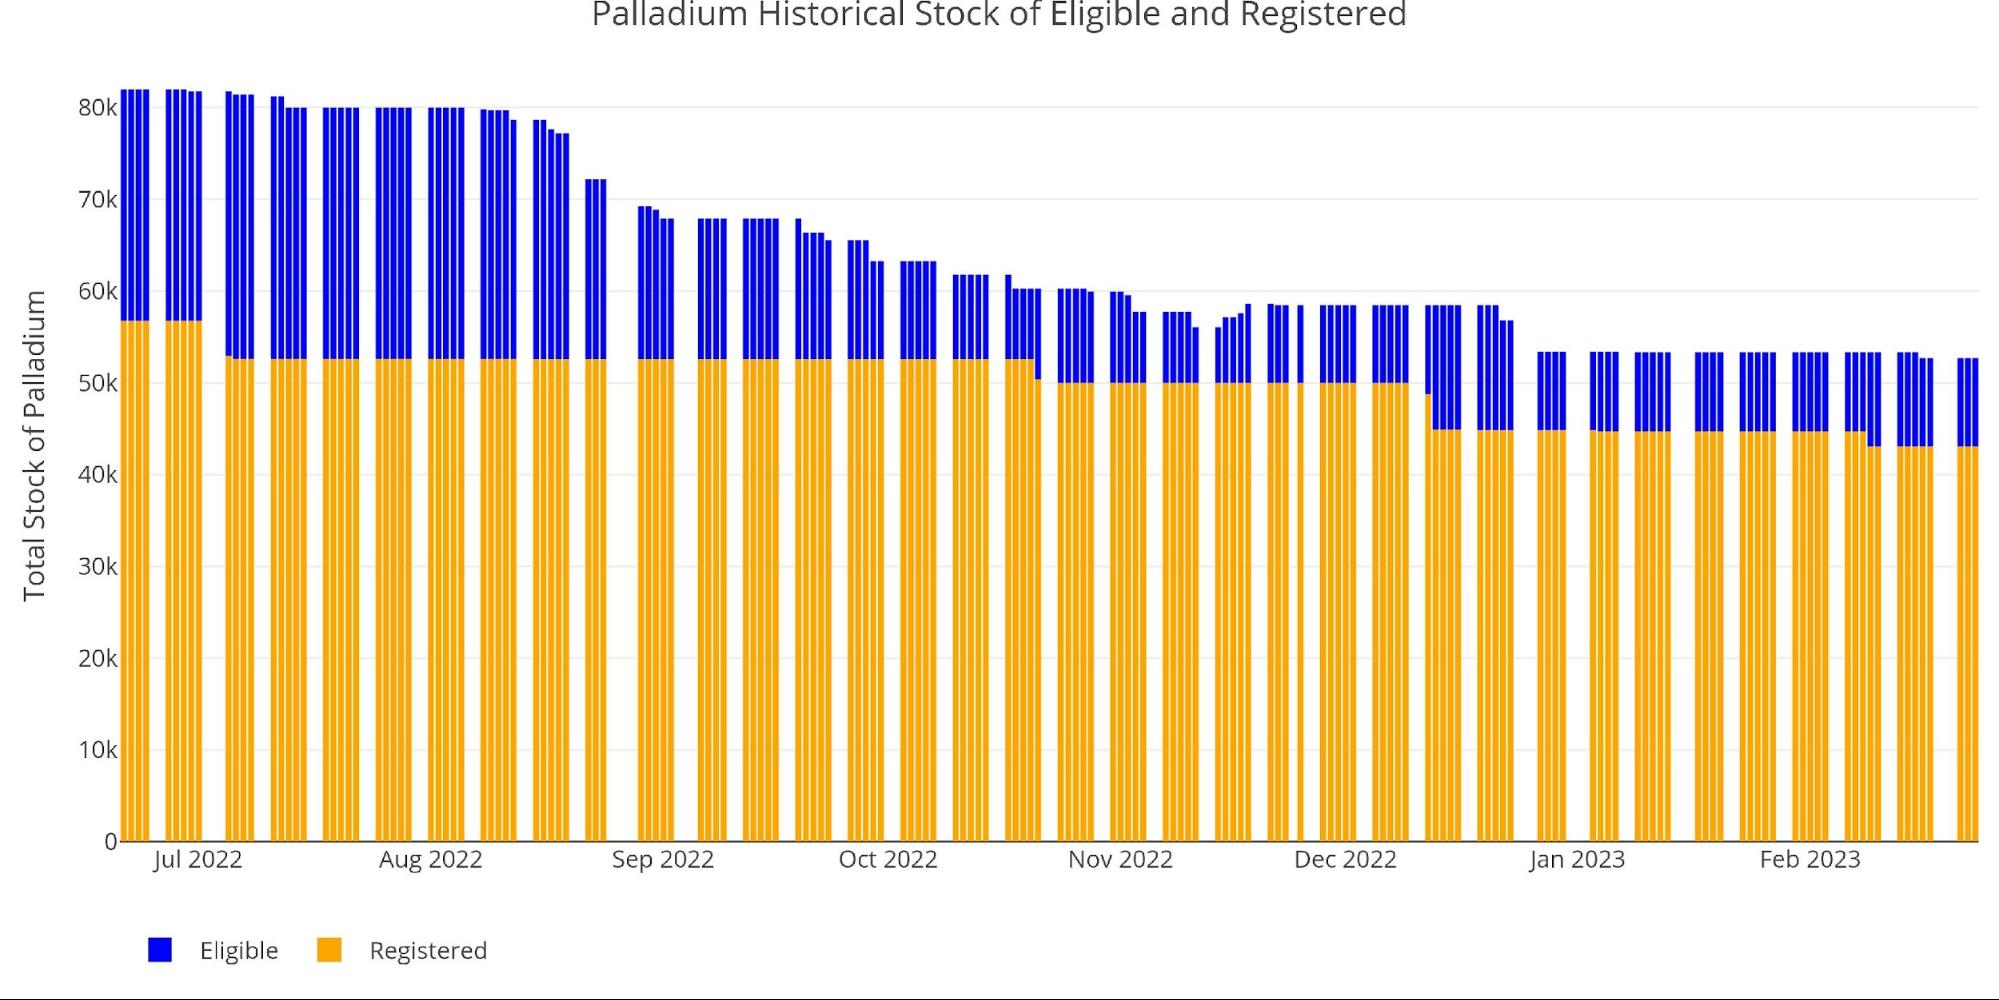
Figure: 23 Palladium Inventory
As First Notice approaches, you can see there was a rather suspicious and large move down with 6 days to go. Palladium is a much smaller market so the activity is harder to mask. In this chart, it most certainly looks like contract holders were getting ready to hold on and then were pushed out all at once. Instead of the slow steady drift down, open interest stayed elevated until they were “pushed” down.
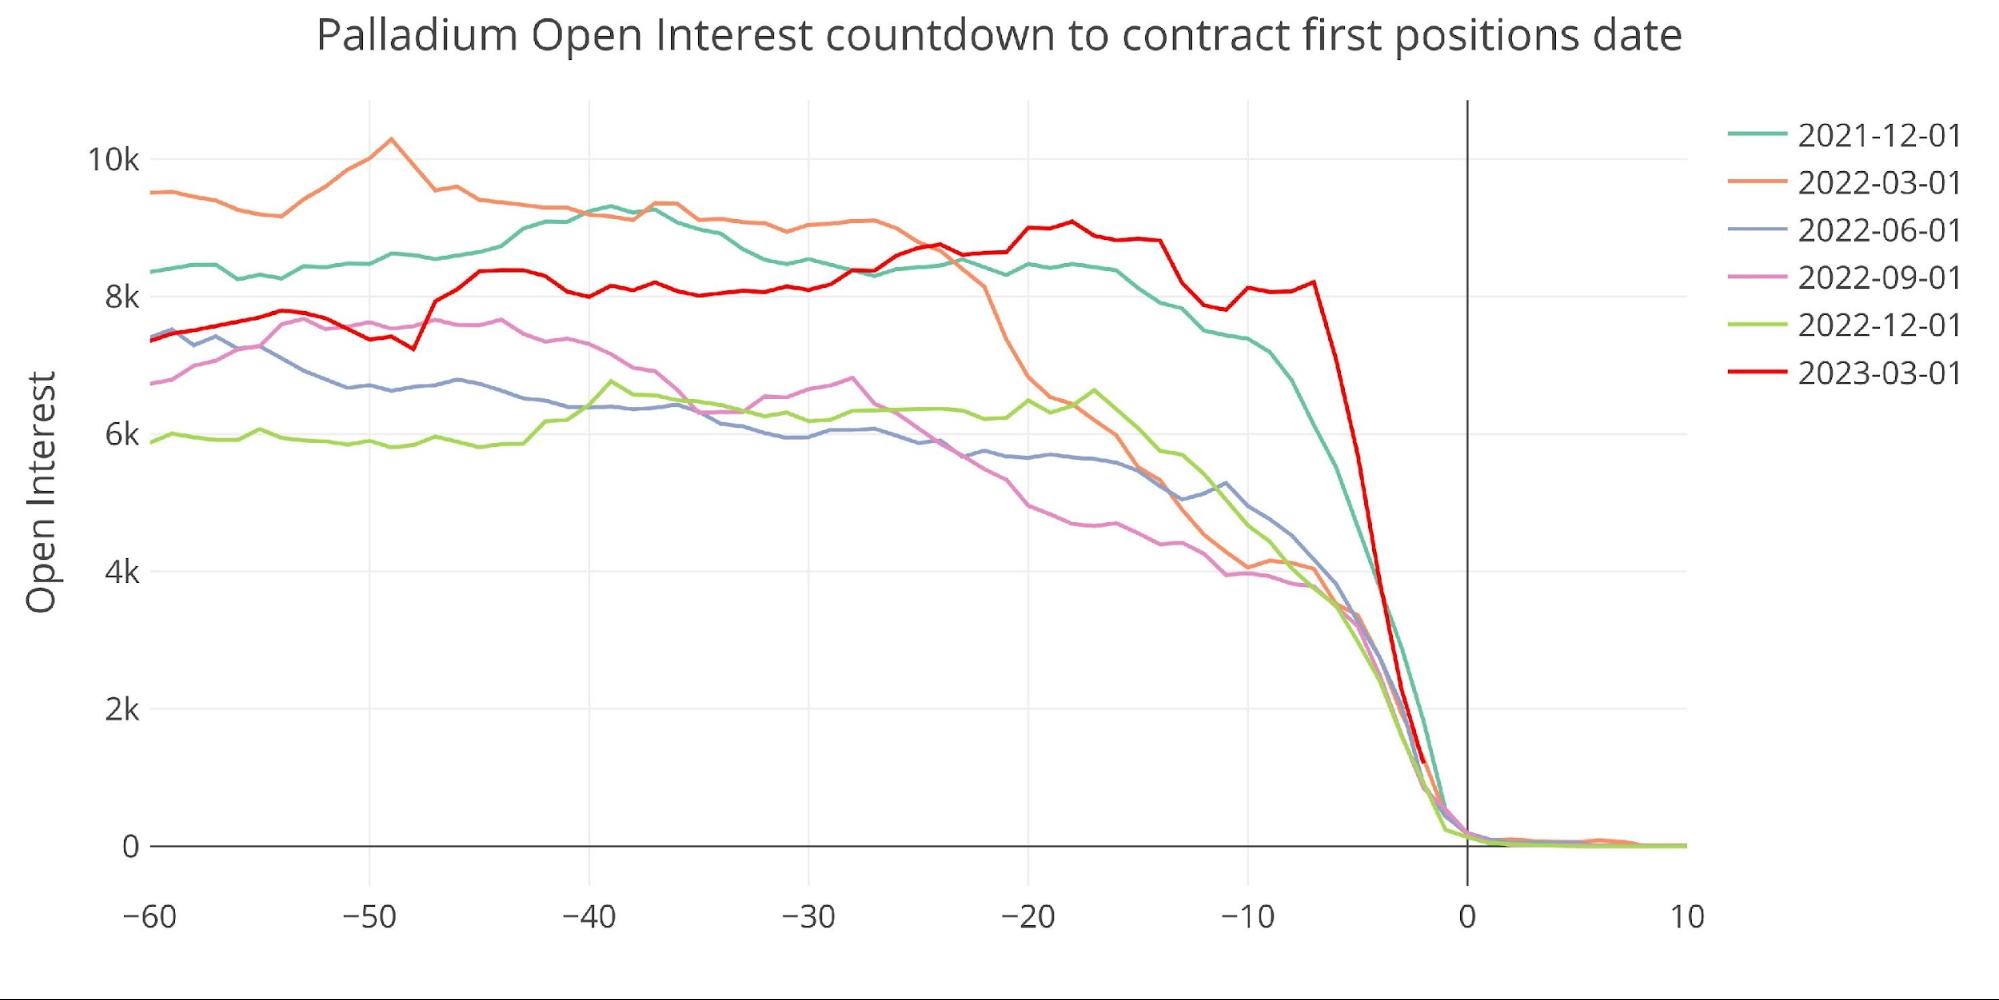
Figure: 24 Open Interest Countdown
Even with the big fall, open interest is still well north of 100% of the available supply. With two days to go, open interest is at 280% of Registered. Again, this will likely be pushed down below 100% by First Notice (2 business days).
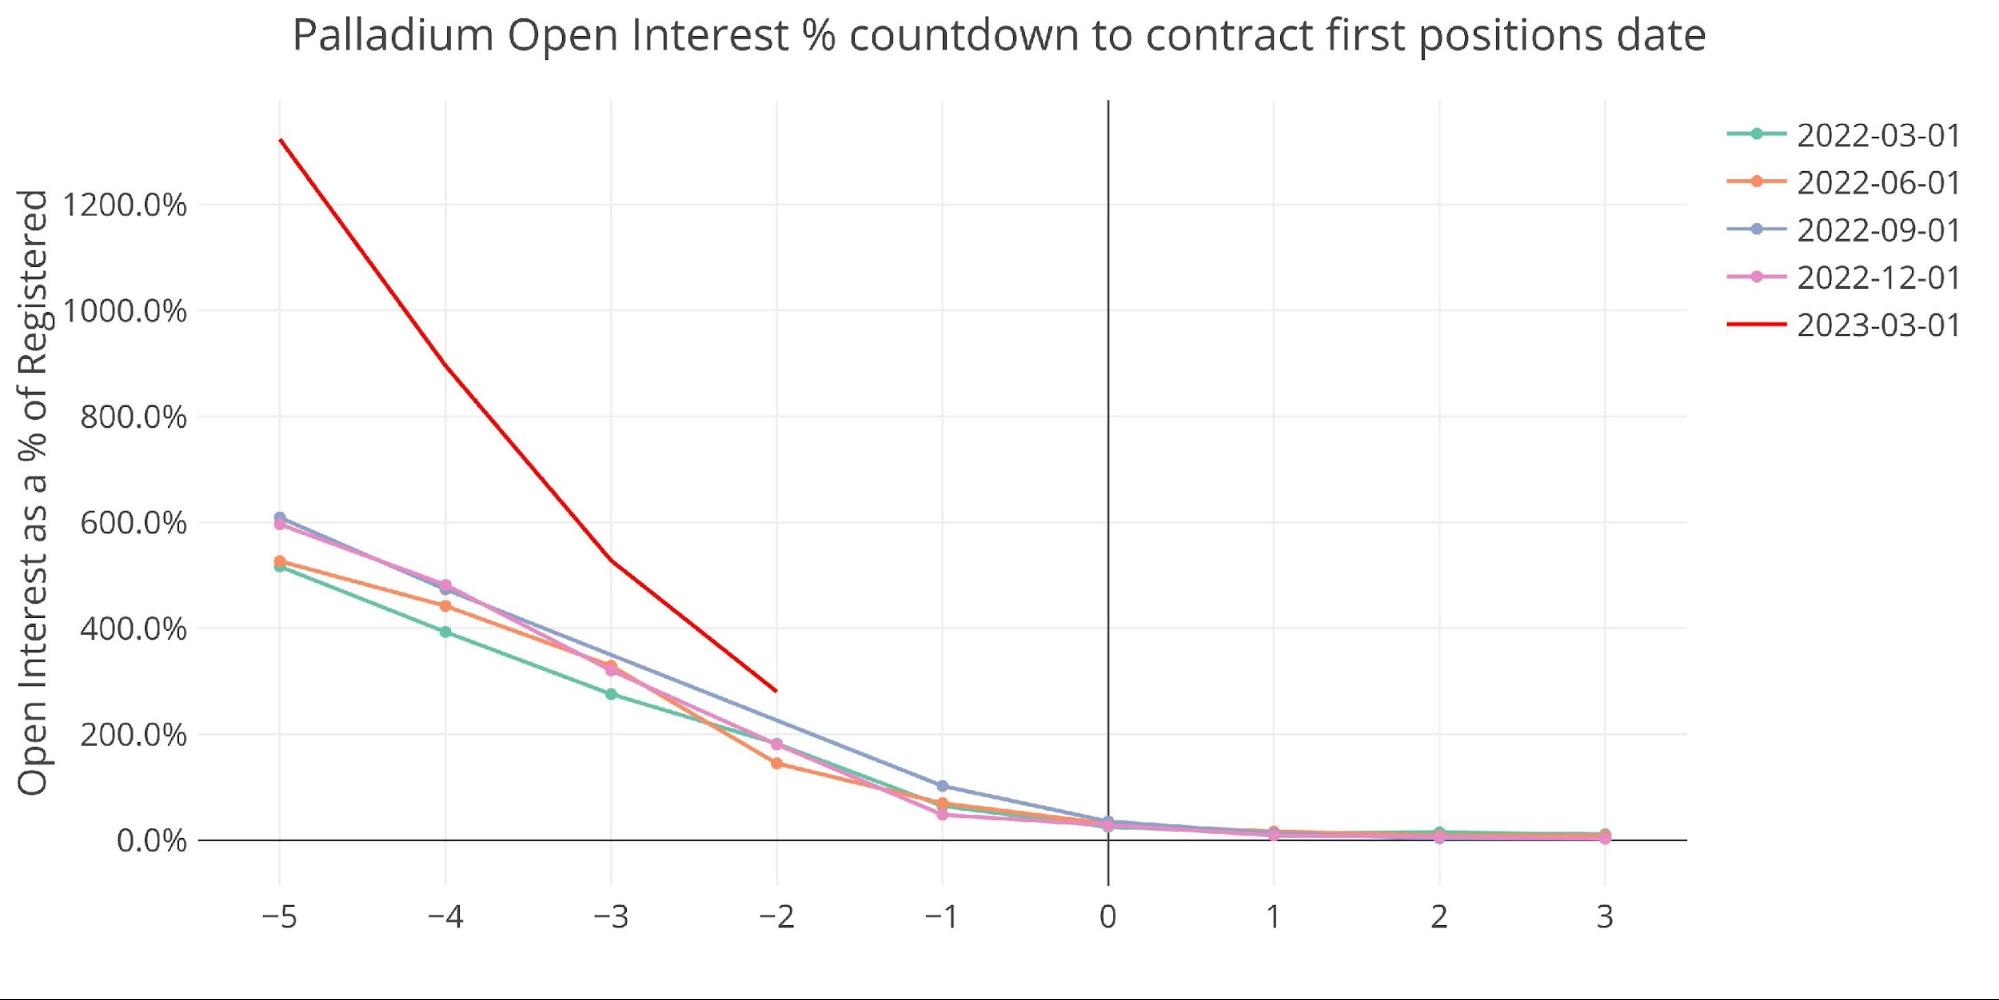
Figure: 25 Countdown Percent
Wrapping up
The paper market in gold and silver is quite different than the physical market. The signs are much more mixed, with technicals pointing to a bullish move in December, then a pullback in late January, and now a need for consolidation to hold above $1800. While the paper market is choppy, the physical market is one direction. Inventories falling and deliveries remaining above pre-Covid levels.
Eventually, the paper market will be repriced to match the physical market. When this happens, prices will be moving much higher.

Figure: 26 Annual Deliveries
Data Source: https://www.cmegroup.com/
Data Updated: Nightly around 11 PM Eastern
Last Updated: Feb 23, 2023
Gold and Silver interactive charts and graphs can be found on the Exploring Finance dashboard: https://exploringfinance.shinyapps.io/goldsilver/

Call 1-888-GOLD-160 and speak with a Precious Metals Specialist today!
Buka akaun dagangan patuh syariah anda di Weltrade.
Source link