Investment demand for physical gold was up by 20% in the second quarter compared to last year, continuing a trend we’ve seen over the last 12 months. This helped push overall gold demand up 7% year on year when including over-the-counter (OTC) sales and stock flows.
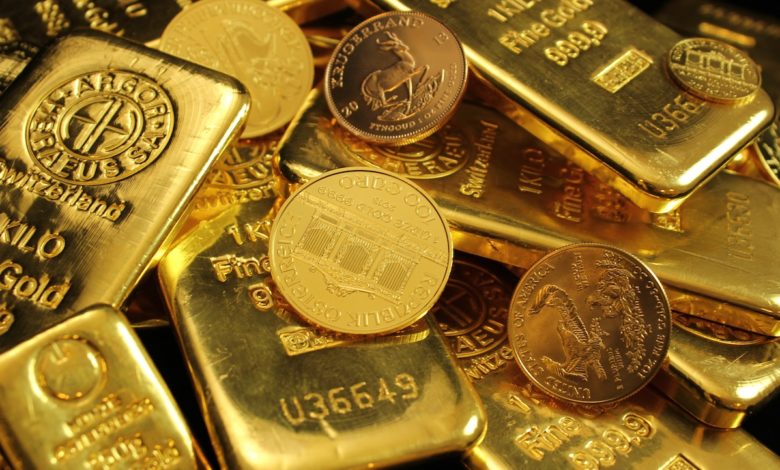
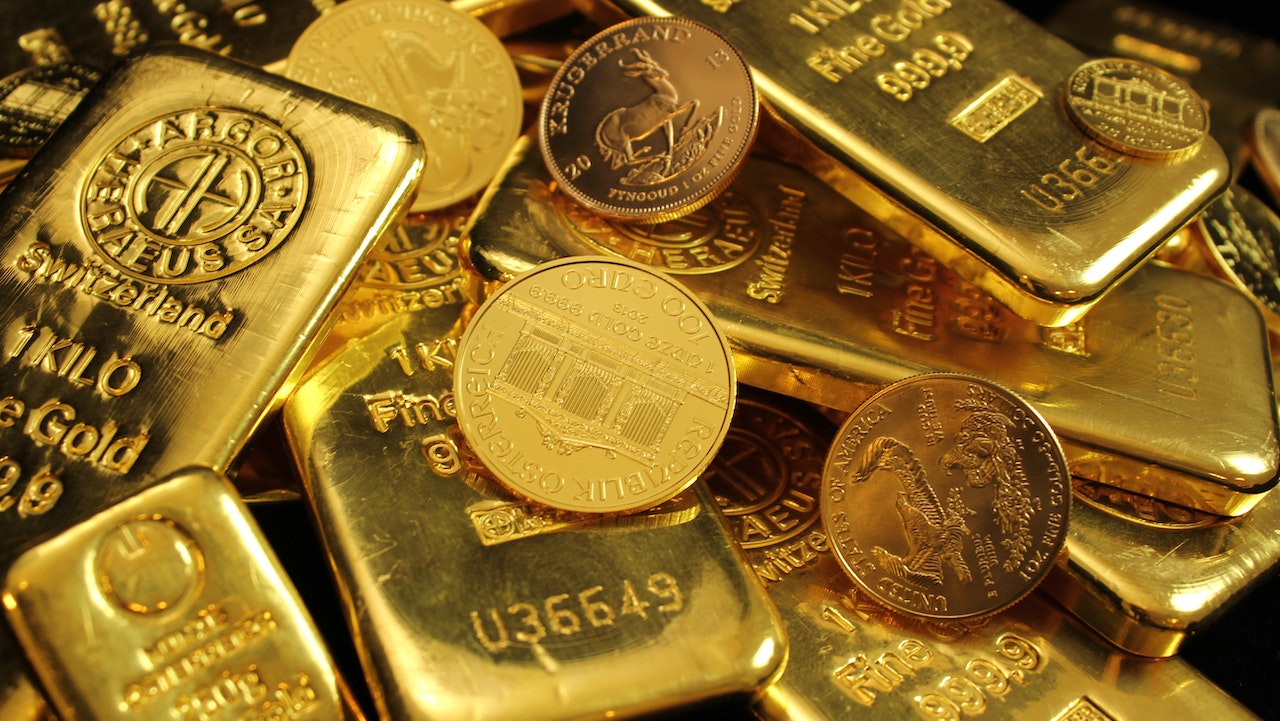
Coin and bar demand came in at 277.5 tons in Q2, a 6% increase over the same quarter last year, according to the World Gold Council Gold Demand Trends for Q2. Gold bars accounted for 162.9 tons of that demand. That was a 6% drop compared to the second quarter of ’22. Coin demand came in at 88.9 tons, a 25% increase year-on-year.
Second-quarter coin and bar demand was 4% above the five-year quarterly average.
Extremely strong demand for physical gold in Turkey and more broadly in the Middle East helped drive gold coin and bar demand higher. Demand in that region offset weak demand in the Eurozone.
We saw this strong demand for physical gold despite a record LBMA gold price that averaged $1,976 per ounce during the quarter. This was a 4% increase over the previous record set in Q3 2020.
A 21.3-ton decrease in gold ETF holdings pulled down overall investment demand to 256.1 tons, but it was still 20% higher compared to the second quarter of last year. The drop in ETF holdings happened despite two straight months of ETF inflows in April and May.
Overall, total second-quarter gold demand fell by 2% compared to Q2 2022 excluding stock flows and OTC transactions. This was partially due to a slowdown in central bank gold buying. Although central banks continued to add to their gold holdings in the second quarter, big sales by Turkey pulled down the net total increase.
When you factor in strong over-the-counter (OTC) gold demand, overall demand was up 7% year on year to 1,255 tons.
OTC trades take place directly between two parties. According to the World Gold Council, hard data on the OTC market is not readily available. It is estimated by factoring in changes to inventories on commodity exchanges, any unobserved changes in fabrication inventories, and any statistical residual.
Industrial gold demand lagged in Q2 due to continued weakness in the consumer electronics market.
Jewelry consumption managed a modest improvement despite the high gold price environment. It was up 3% year-on-year to 476 tons.
Excluding OTC transactions, gold demand was down 6% through the first half of 2023 at 2,062 tons, but when you factor in the strong OTC market, demand was up 5% to 2,460 tons.

Call 1-888-GOLD-160 and speak with a Precious Metals Specialist today!
Buka akaun dagangan patuh syariah anda di Weltrade.
Source link