Mastery trade Gold XAUUSD 6 DEC 2022 for Fundamental Analysis and Technical Analysis

Gold : Fundamental Factors
1) ISM Services PMI is at 56.5 compare to 53.5 which was forecasted, this could fit to inflationary pressures.
2) The strong jobs number could make the Federal Reserve rethink its plan to impose smaller rate hikes here on to curb inflation when the central bank holds its monthly policy meeting on Dec 14.
3) China has still given no signal that it will scale back the entirety of its zero-COVID policy, having so far scaled back only select measures in its major cities.
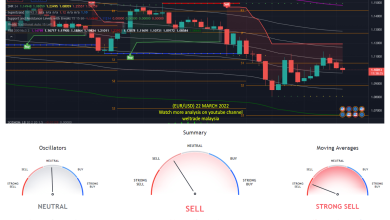
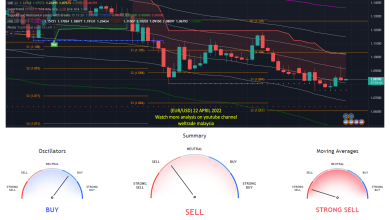
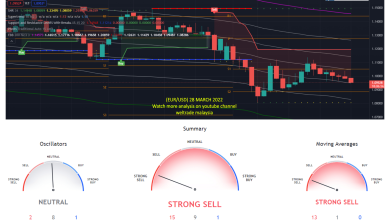
Trend is Bearish.
Fundamental Range : 1,767.63-1,770.88

Gold : Technical Analysis
Check at Daily Timeframe Support and Resistance for Fibonacci.
Check based on the current timing for the Support and Resistance when you want to go into trade.
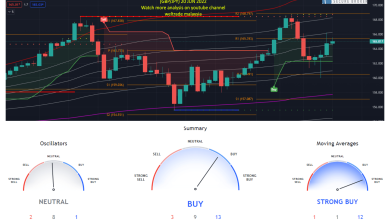
Resistance Area : 1798.68,1809.11,1825.98
Support Area : 1764.94,1754.51 ,1737.64
Pivot point :1781.81
Confirm with technical indicators and based on your own technical analysis for the trend.
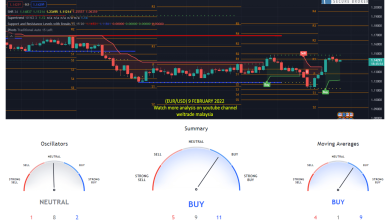
Check investing.com to get more info on what most indicator would display
Can see moving average also to know what it is indicating.
Moving average at the daily supports towards Buy, weekly timeframe also, buy and monthly is strong buy
Check higher timeframe also for more confirmation for entry in Daily timeframe.
The technical indicator display strong buy in Daily and strong buy in weekly and sell in monthly timeframe.
Use linear regression to get confirmation trend at daily as they are not available in investing.com
Linear regression shows a neutral at the daily timeframe .Can check linear regression trend in weekly and monthly for more confirmation.For weekly, it is neutral and for monthly,it is showing uptrend.
Use Bolinger Band Strategy Tester and RSI Strategy Tester to get more confirmation for the trend and percent profitable.Check at bigger timeframe also such as weekly and monthly.
Ensure that both RSI strategy and Bolinger Band Strategy gives above 50%. for the percent profitable
RSI strategy tester and Bolinger Band Strategy Tester at the daily and weekly has percentage higher than 50% , supporting towards neutral compare to the other timeframe such as Monthly.
Find sell at the chart by using the first resistance point,1798.68 , and take profit will be at the pivot point,1781.81 , stop loss at support 2 ,1809.11 (SEE CURRENT MARKET PRICE)
See current market and find the nearest support point for entry and take profit at the pivot point.
Fundamental and Technical analysis must be aligned
For further information, contact me ,Gurmit at +60142584067, I will guide anyone who wants to register with Weltrade. You can register at the link below. Thank you.
https://my.weltrade.com/?r1=ipartner&r2=49989
DISCLAIMER :This analysis is based on Investing.com and Forexfactory.com. You may follow based on your own discreetion.
Can join at our telegram group at https://t.me/weltrade_my
For traders who want to trade on their own can join Weltrade, we provide benefits for traders out there, learn to trade and follow free signals such as free paid signal providers, bookmap gold and tradingview premium live.
Free Bookmap Education t.me/+JetSe33YA0U2ZDk1
Join us at our zoom for online learning from 10.30am to 11.30am by the Financial Markets Research Center (FMRC) team. With Cikgu Hafiz and Cikgu Gurmit
Link: https://us06web.zoom.us/j/81843968428?pwd=VkZ3L2UrcXh2WlZsZHU3ZFFGUmJMQT09
Komen anda
Source link