DXY Index Poised Ahead of US CPI as Crude Oil Steadies. Where to for US Dollar (DXY)?

US Dollar, DXY, USD, Crude Oil, US CPI – Talking Points
- The US Dollar Index could see volatility on the back of inflation data
- APAC equities, currencies and commodities were quiet in anticipation
- With crude oil prices at elevated levels, will CPI get a boost to lift USD?
The US Dollar has softened in the last week or so as Federal Reserve speakers have tried to wind back the markets perception of the level of hawkishness within the Federal Open Market Committee (FOMC).
Today’s US CPI number could be a source of volatility for markets that are expecting an annual headline rate of 7.2% according to a Bloomberg survey.
US 10-year Treasury yields have a softened 5 basis points from their recent peak to be 1.92% while the 2-year note continued higher in yield above 1.35%. The Japanese Government Bond (JGB) is trading at 6-year highs above 0.20%.
A strong Wall Street lead didn’t help APAC equites, with Chinese and Hong Kong stocks lower today, while Australian and Japanese indices were barely in the green.
Crude oil prices have been relatively stable today compared to the volatile moves seen recently.
Overnight data showed a drop in US stockpiles, but the market seemed to be more focused on the progress for an Iran nuclear deal, which would add supply to global markets.
Talks with Iran have resumed in Vienna and the US has indicated that a deal could be reached that addresses all parties concerns.
According to the EIA/DOE weekly petroleum status report, stockpiles fell by 4.75 million barrels, against forecasts of around a million barrels being added.
There was also comments/jawboning from the White House indicating that the crude oil strategic reserves could be tapped if necessary.
Backwardation is still in play for the crude oil futures market.
Backwardation is when the contract closest to settlement is more expensive than the contract that is settling after the first one. It highlights a willingness by the market to pay more to have immediate delivery, rather than waiting.
The WTI first and second contract difference is currently at US$ 1.15 bbl, well down from the US$ 2.19 bbl high seen last Friday. It is still significantly above the 2021-2022 average of US$ 0.11 bbl.
Currencies and commodities had a very quiet day in Asia. This is despite the Chinese authorities continuing their crack down on what they perceive to be overly high commodities prices. Yesterday iron ore was the focus, today it was coal.
Alongside today’s US CPI number, there will be jobless claims data for the US.
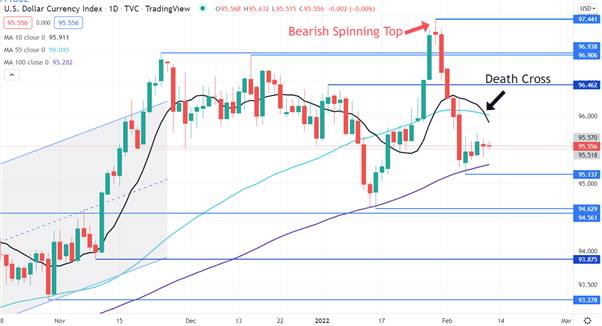
US Dollar (DXY)Technical Analysis
After making a high at 97.441 at the end of January, a bearish Spinning Top Candlestick was formed.
Since the crash lower, the price has consolidated with the 10-day simple moving average (SMA) recently crossing over the 55-day SMA, indicating a Death Cross. This could signal that bearish momentum may evolve.
Support might be at the 100-day SMA, currently at 95.282, or further down at the previous lows and pivots points of 95.137, 94.629, 94.561, 93.875 and 93.278.
On the topside, resistance could be at the pivot points of 96.462, 96.906, 96.938 or the January high of 97.441.
— Written by Daniel McCarthy, Strategist for DailyFX.com
To contact Daniel, use the comments section below or @DanMcCathyFX on Twitter
Buka akaun dagangan patuh syariah anda di Weltrade.
Source link