The September Trade Deficit increased for the first time in 6 months to -$73.3B. The Deficit had been getting help from exports out of the Strategic Petroleum Reserve.
As shown by the chart below, the increase this month was from a drop in Exports combined with an increase in Imports. The current value is still well below the record set back in March.
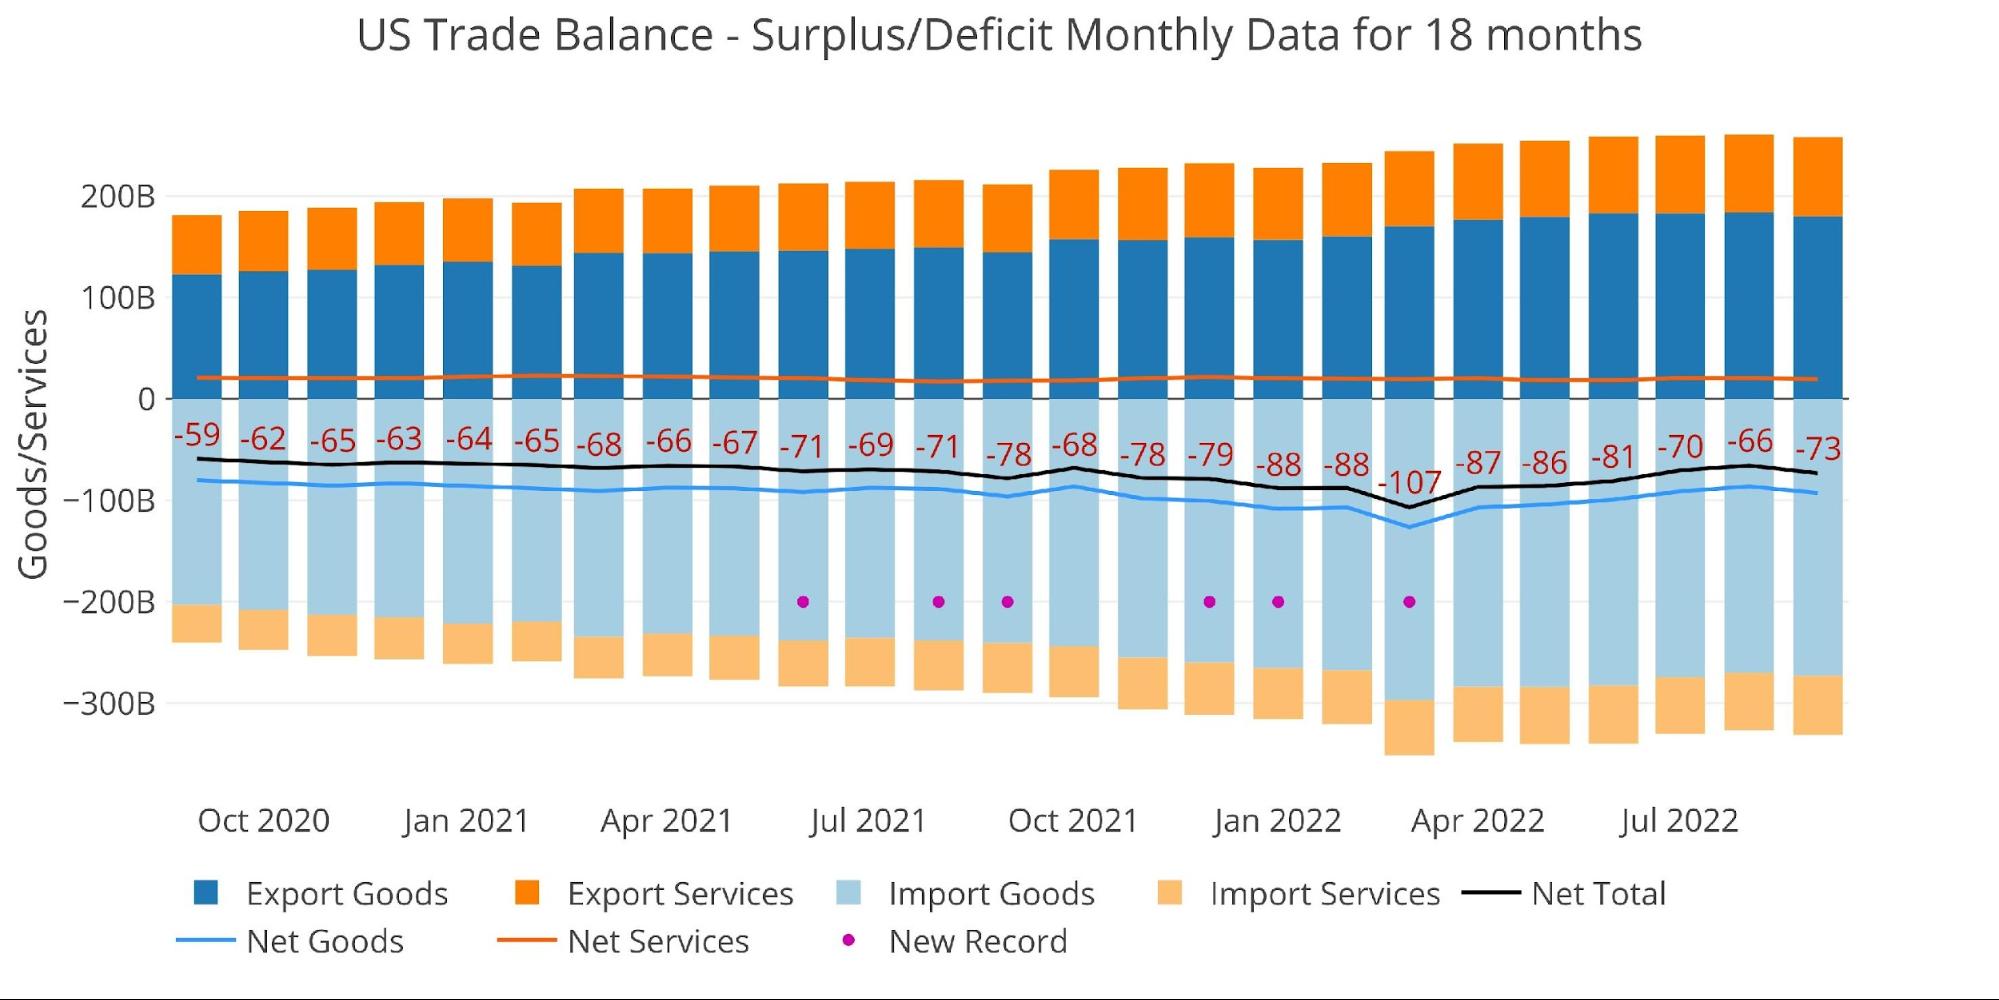
Figure: 1 Monthly Plot Detail
The table below provides detail.
Monthly Trade Deficit
-
- MoM Exported Goods are down 2%
-
- Imported Goods were up 1.1%
-
- On a net basis, the Goods Deficit surged 7.6% MoM but was down 3.6% YoY
-
- The YoY fall is mainly driven by Exports increasing more than Imports
-
- The Services Surplus fell by 5% MoM
- MoM Exported Goods are down 2%
Looking at Trailing Twelve Month:
-
- The TTM Net Deficit fell slightly from -$975B last month to -$970B
-
- YoY, the TTM Deficit is still up 20% from -$810B
-
- The TTM Services Surplus continues to shrink and is down almost 3.9% since last September
- The TTM Net Deficit fell slightly from -$975B last month to -$970B
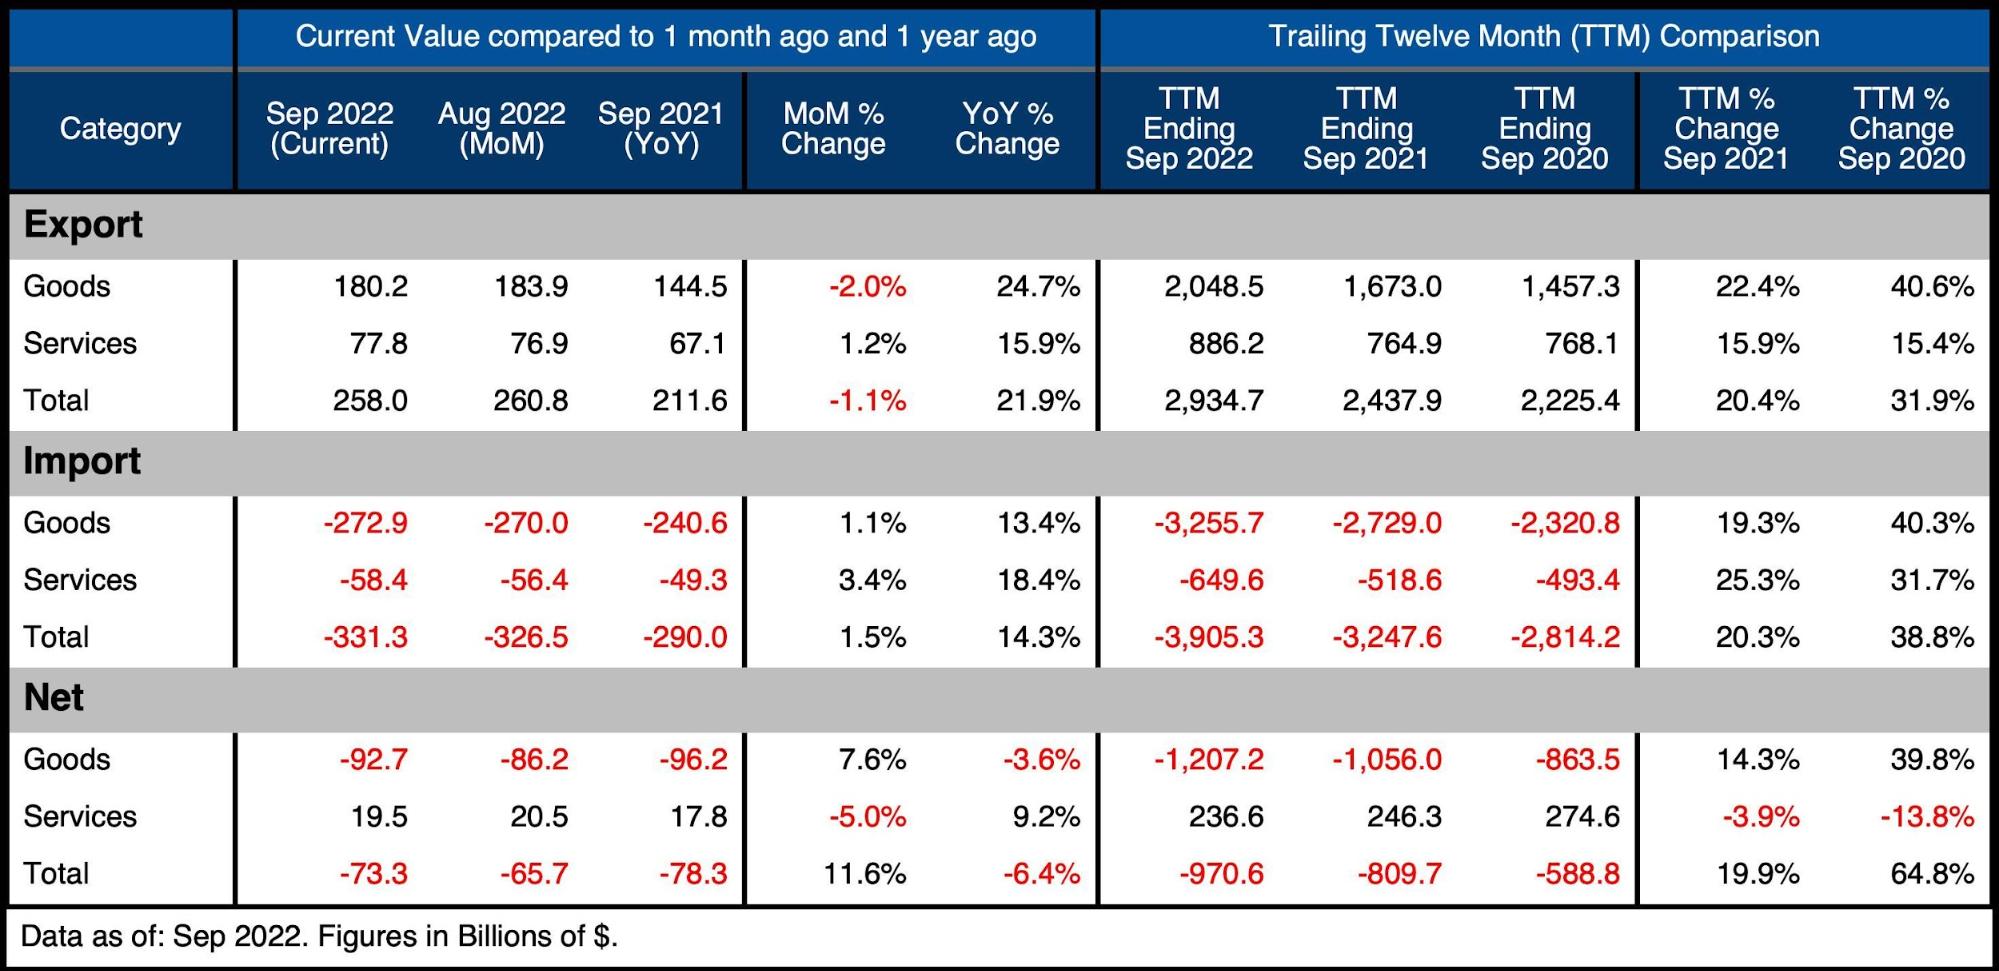
Figure: 2 Trade Balance Detail
Historical Perspective
Zooming out and focusing on the net numbers shows the longer-term trend. The massive Deficit spike in March was fully reversed but is trending back down after the latest month. The last time the Trade Deficit collapsed so quickly was in 2008 and lasted until June 2009.
There are competing forces at play. As we are just entering a recession, the trade deficit may shrink as inflation and falling demand drop the number of Imported Goods. On the flip side, inflation could drive overall numbers higher even if the volume of goods stays flat or even falls. Furthermore, because the recession is global in nature, exports of both goods and services could fall.
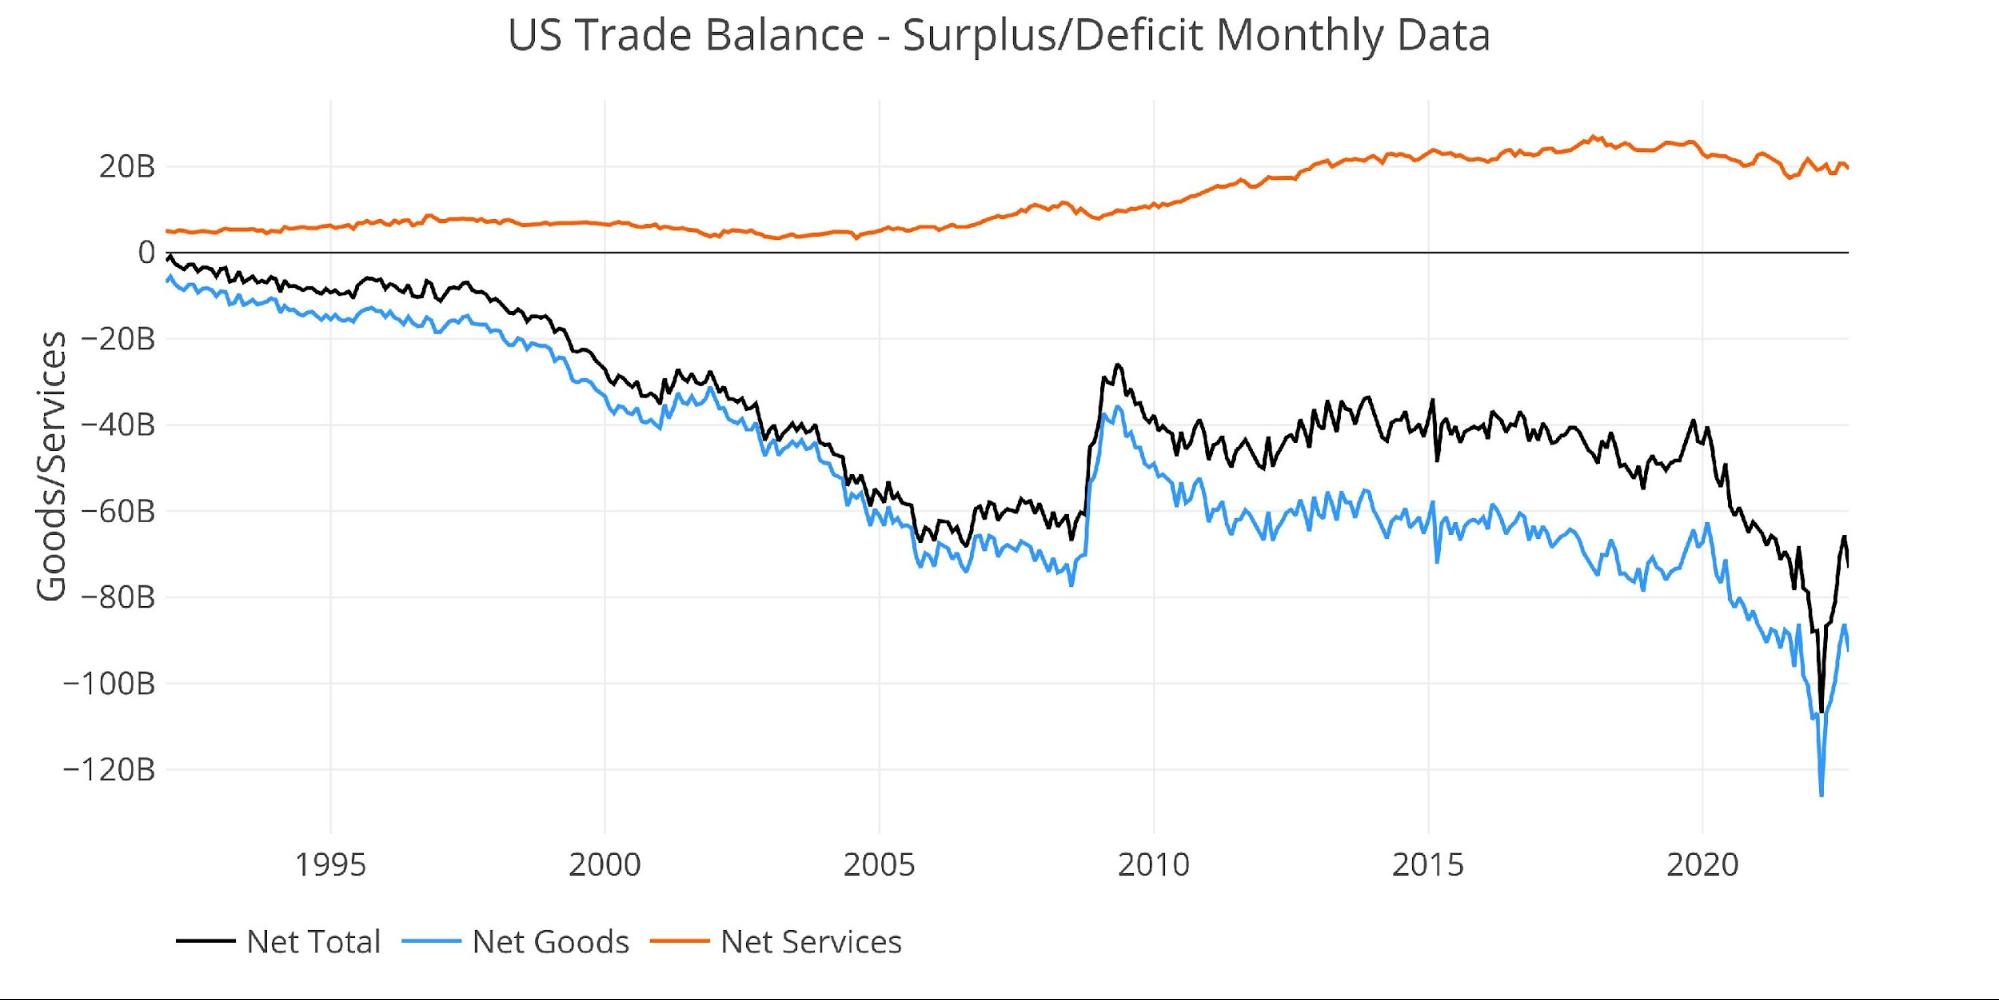
Figure: 3 Historical Net Trade Balance
The chart below zooms in on the Services Surplus to show the wild ride it has been on in recent months. It compares Net Services to Total Exported Services to show relative size. After hovering near 35% since 2013, it dropped below 30% in July last year. It now sits at 25% down from the 26.6% registered only last month. As the Services Surplus continues to shrink, it will act like a tailwind to larger deficits.
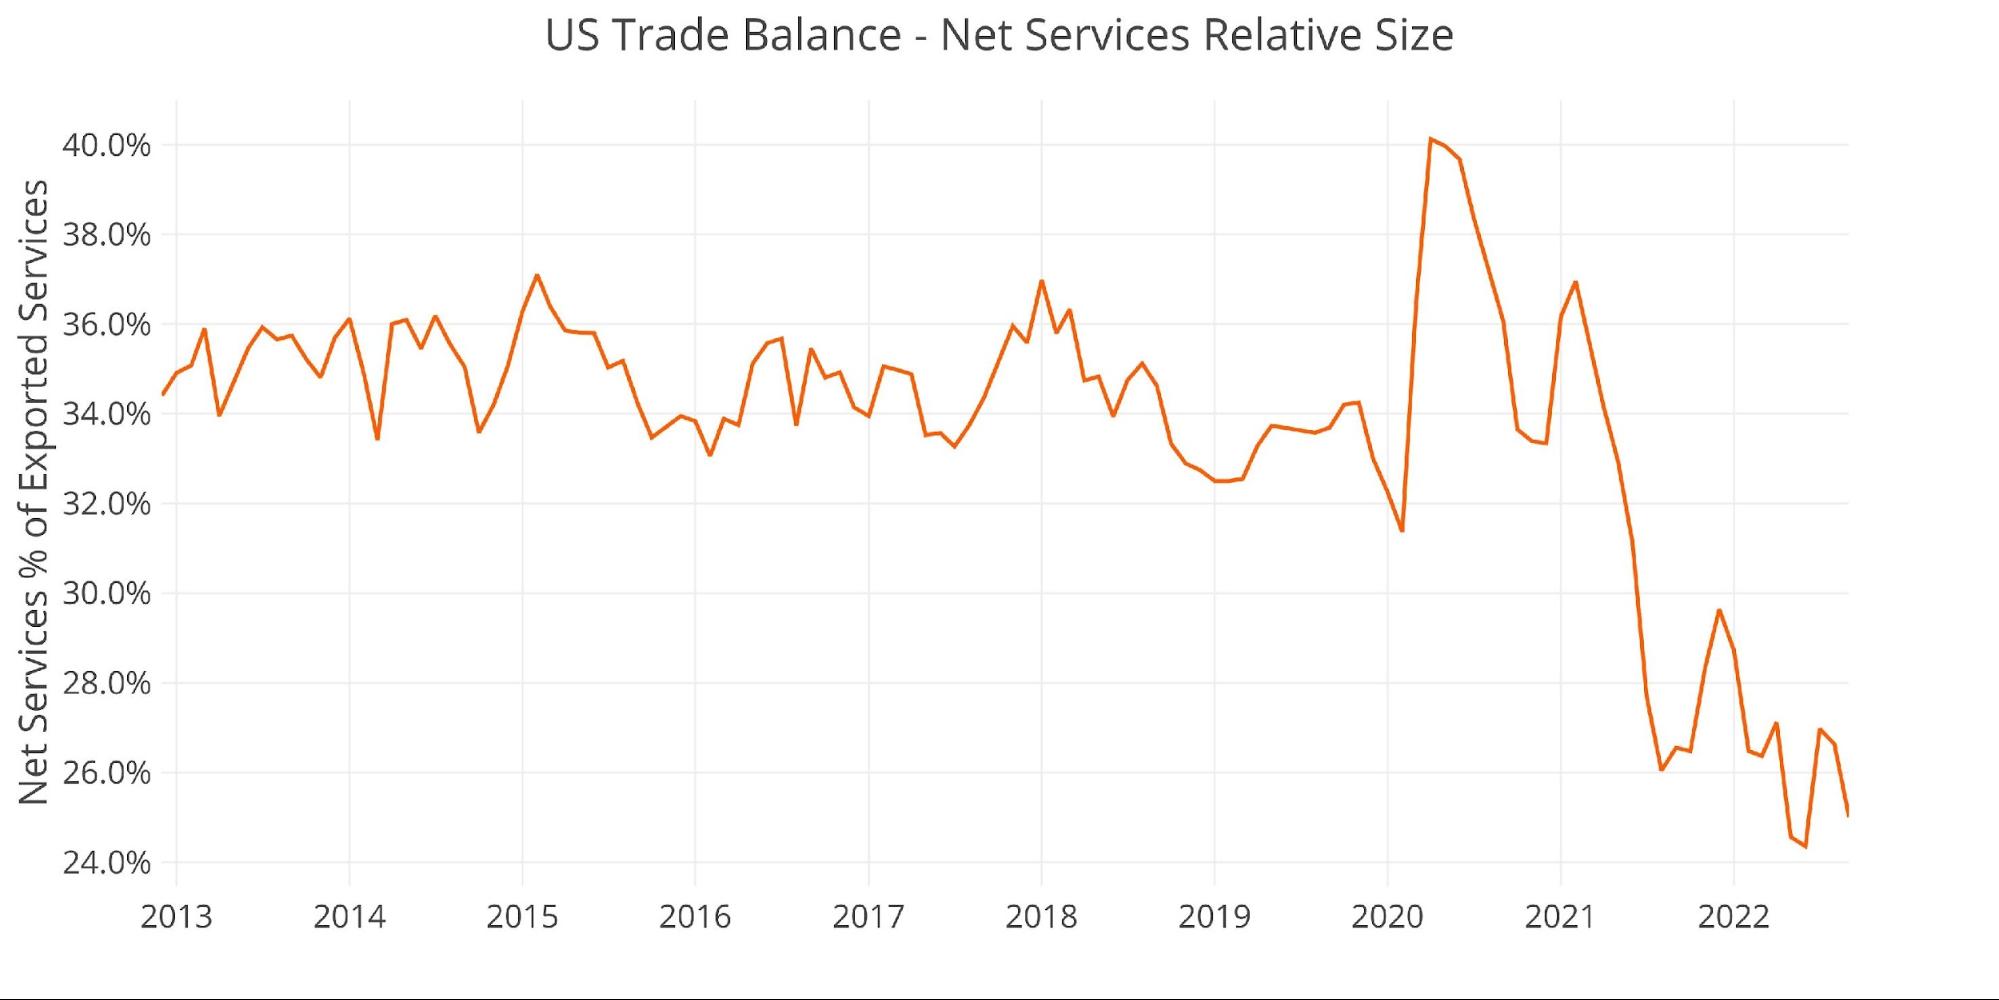
Figure: 4 Historical Services Surplus
To put it all together and remove some of the noise, the next plot below shows the Trailing Twelve Month (TTM) values for each month (i.e., each period represents the summation of the previous 12 months).
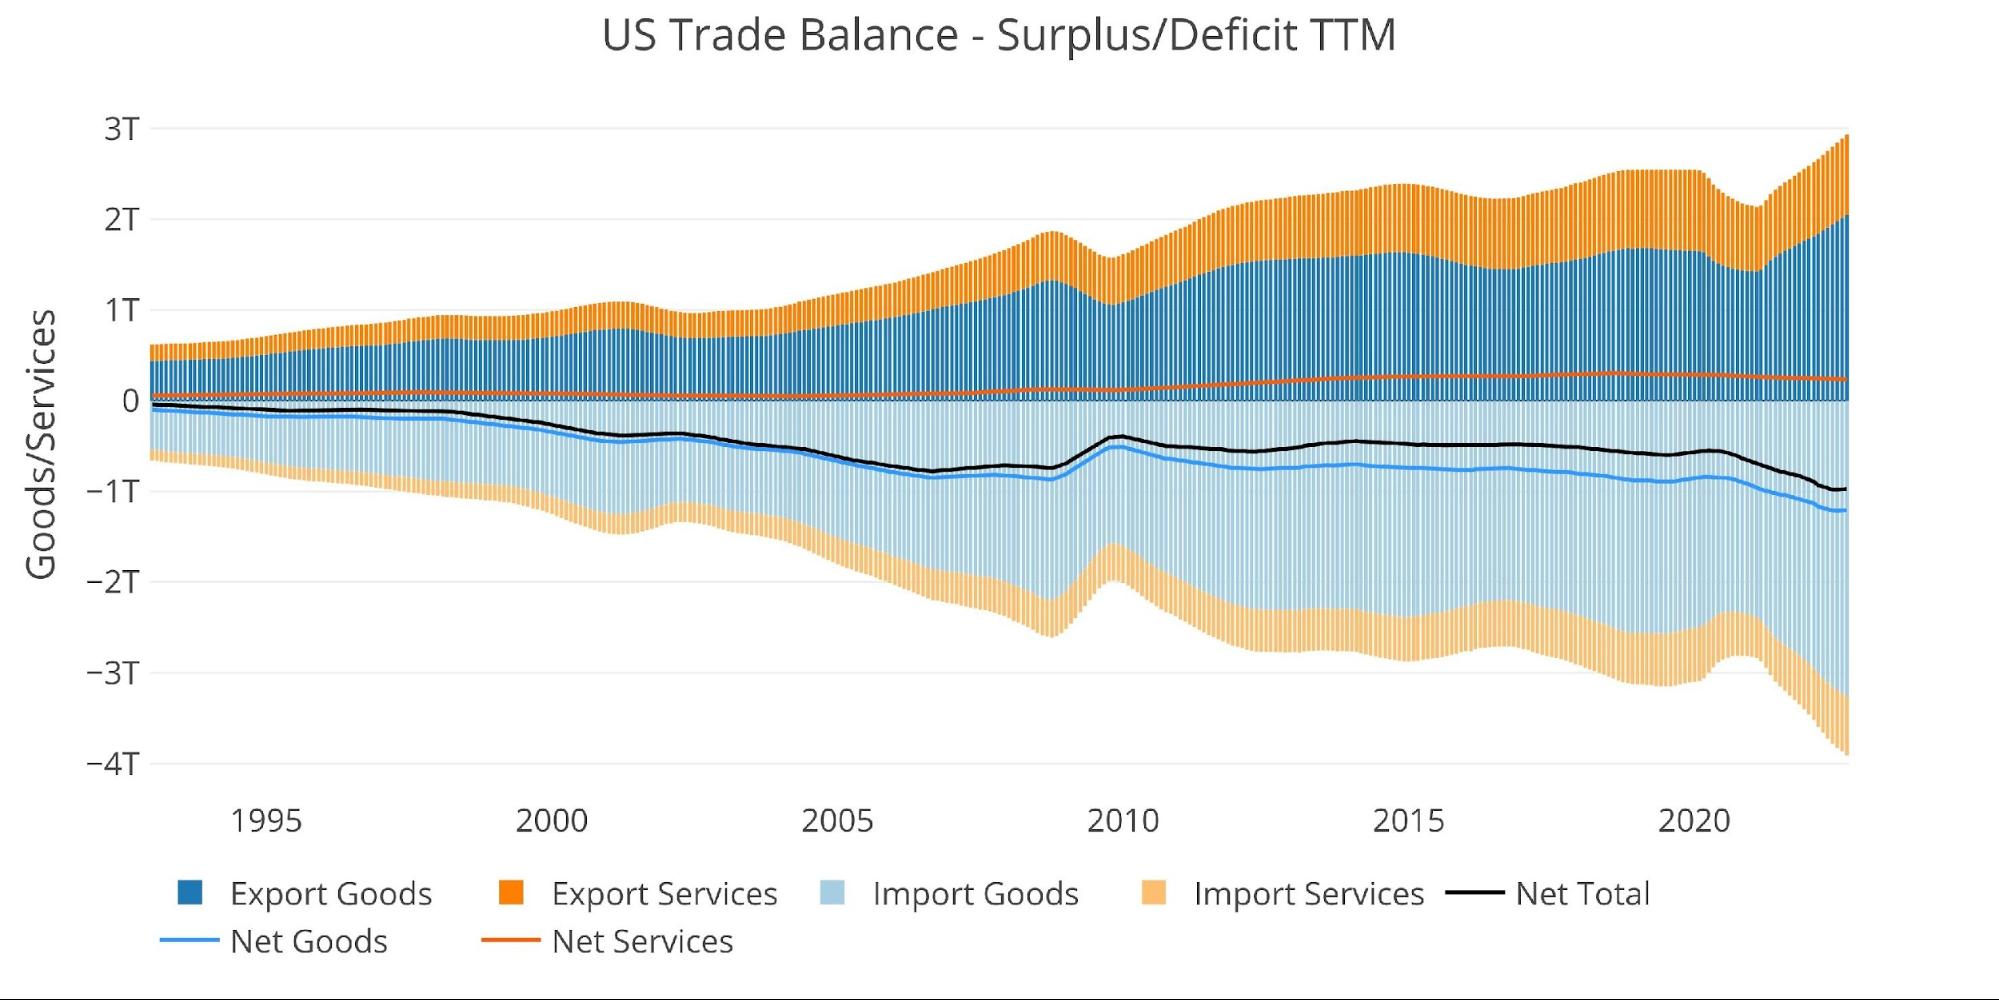
Figure: 5 Trailing 12 Months (TTM)
Although the TTM Net Trade Deficits is near historical highs, it can be put in perspective by comparing the value to US GDP. As the chart below shows, the current records are still below the 2006 highs before the Great Financial Crisis.
The current 3.78% is down on the back of higher GDP and also the fall in the TTM trade deficit in recent months.

Figure: 6 TTM vs GDP
The chart below shows the YTD values. 2022 is well above prior years by a significant margin. Even though Exports have surged this year, it has been offset by even bigger increases in Imports.
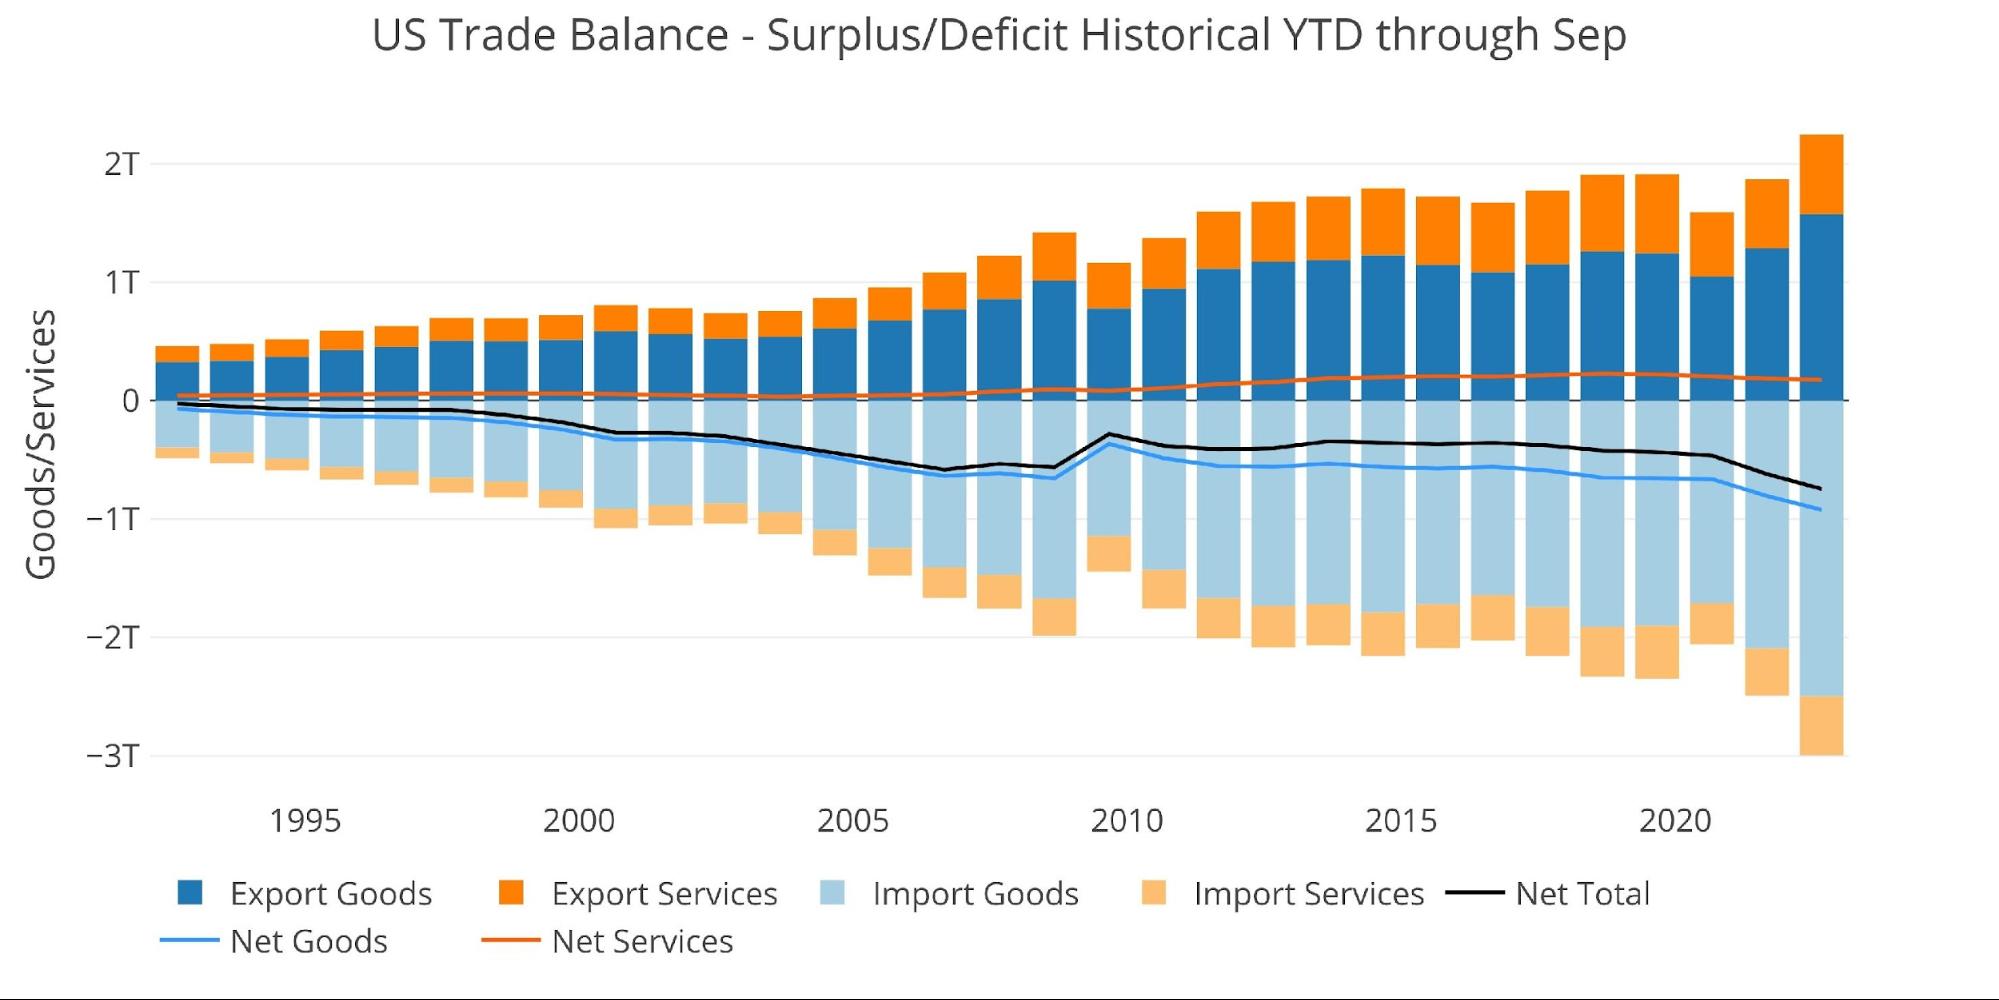
Figure: 7 Year to Date
What it means for Gold and Silver
The Trade Deficit in 2022 exploded to new all-time highs and then came back down some. It will be interesting to see if the latest month is a blip or another change in direction back to new record highs. The recession could have multiple effects on the trade deficit, decreasing demand for Imports but also slowing Exports.
Over the decades, the world has been happy to send the US goods in exchange for paper dollars. How much longer will this arrangement be allowed to last? Everyone is getting squeezed by a strong dollar right now, but with so many dollars now abroad, it may be time for central banks to defend their currencies by selling dollars. If the dollar starts to fall, new record-high trade deficits are all but a certainty.
As trade deficits continue to soar, it could even put more downward pressure on the dollar and support the price of gold and silver. Do not confuse strong Imports with a strong economy. The US now produces very little and is dependent on the rest of the world for a lot of goods. This is a dangerous place to be.
Data Source: https://fred.stlouisfed.org/series/BOPGSTB
Data Updated: Monthly on one month lag
Last Updated: Nov 03, 2022, for Sep 2022
US Debt interactive charts and graphs can always be found on the Exploring Finance dashboard: https://exploringfinance.shinyapps.io/USDebt/

Call 1-888-GOLD-160 and speak with a Precious Metals Specialist today!
Buka akaun dagangan patuh syariah anda di Weltrade.
Source link