Mastery Trading strategy for GOLD XAUUSD 21 November 2022 for Fundamental Analysis and Technical Analysis


Gold : Fundamental Factors
1) Global equities edged up and a key part of the Treasury yield curve inverted further on Friday, a sign the U.S. economy will stall next year and that investors hope will lead the Federal Reserve to back off its aggressive hiking of interest rates.
2) Strong retail sales data this week hammered home the idea that the Fed will tighten monetary policy further even though soft consumer and producer price pressures suggested inflation has peaked and would allow for lower rates.
3) China is still holding to its zero covid policy, no any impact on the copper demand for now and it is still remain stagnant.
Trend is Bearish
Fundamental Range: 1,750.12 – 1,753.11
Gold : Technical Analysis
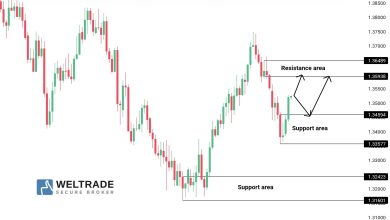
Check at Daily Timeframe Support and Resistance for Fibonacci.
Check based on the current timing for the Support and Resistance when you want to go into trade.
Support Area : 1751.24 ,1750.80,1750.08
Resistance Area : 1752.68,1753.12,1753.84
Pivot Point : 1751.96
Confirm with technical indicators and based on your own technical analysis for the trend.
Check investing.com to get more info on what most indicator would display
Check higher timeframe also such as weekly and monthly for more confirmation for entry in Daily timeframe.
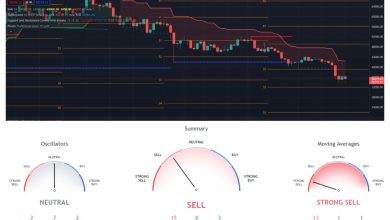
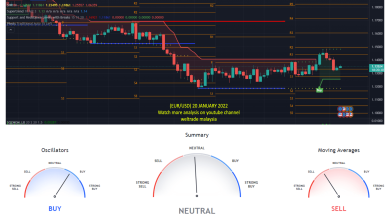
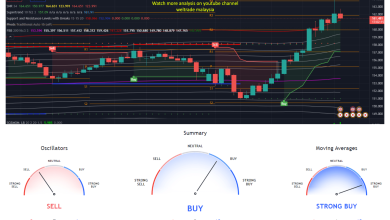
The technical indicator display strong buy in Daily and buy in weekly and strong sell in monthly timeframe, where we can entry buy for higher timeframe by following the support area given and vice versa
Use linear regression to get confirmation trend at daily as they are not available in investing.com
Linear regression shows a downward trend at the daily timeframe .Can check linear regression trend in weekly and monthly for more confirmation.For weekly, it is downtrend and for monthly,it is showing uptrend.
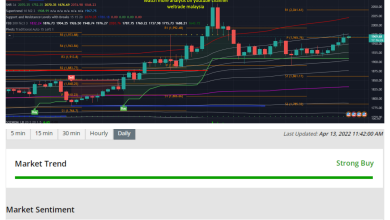
Use Bolinger Band Strategy Tester and RSI Strategy Tester to get more confirmation for the trend and percent profitable.Check at bigger timeframe also such as weekly and monthly.
Ensure that both RSI strategy and Bolinger Band Strategy gives above 50%. for the percent profitable
RSI strategy tester and Bolinger Band Strategy Tester at the daily has percentage higher than 50% , supporting towards downtrend ,weekly towards downtrend also compare to Monthly at uptrend.
Gold : Find sell at the daily chart by using the first resistance point,1752.68 , and take profit will be at the pivot point,1751.96 , stop loss at resistance 2 ,1753.12 (SEE CURRENT MARKET PRICE)
See current market and find the nearest support point for entry and take profit at the pivot point.
Fundamental and Technical analysis must be aligned.
For further information, contact me ,Gurmit at +60142584067, I will guide anyone who wants to register with Weltrade. You can register at the link below. Thank you.
https://my.weltrade.com/?r1=ipartner&r2=49989
DISCLAIMER :This analysis is based on Investing.com and Forexfactory.com. You may follow based on your own discreetion.
Can join at our telegram group at https://t.me/weltrade_my
For traders who want to trade on their own can join Weltrade, we provide benefits for traders out there, learn to trade and follow free signals such as free paid signal providers, bookmap gold and tradingview premium live.
Free Bookmap Education t.me/+JetSe33YA0U2ZDk1
Join us at our zoom for online learning from 10.30am to 11.30am by the Financial Markets Research Center (FMRC) team. With Cikgu Hafiz and Cikgu Gurmit
Link: https://us06web.zoom.us/j/81843968428?pwd=VkZ3L2UrcXh2WlZsZHU3ZFFGUmJMQT09
Komen anda
Source link