
Breaking Down the Balance Sheet
The Fed has a targeted balance sheet reduction of $95B a month. Up until this point, the Fed had failed to reach its target almost every month since QT began.
In the latest month, the Fed made up for their recent shortfall with a big balance sheet reduction of $139B, exceeding their target by 50%! Despite the larger-than-expected reduction, the Fed still missed its target on Mortgage Backed Securities (MBS).
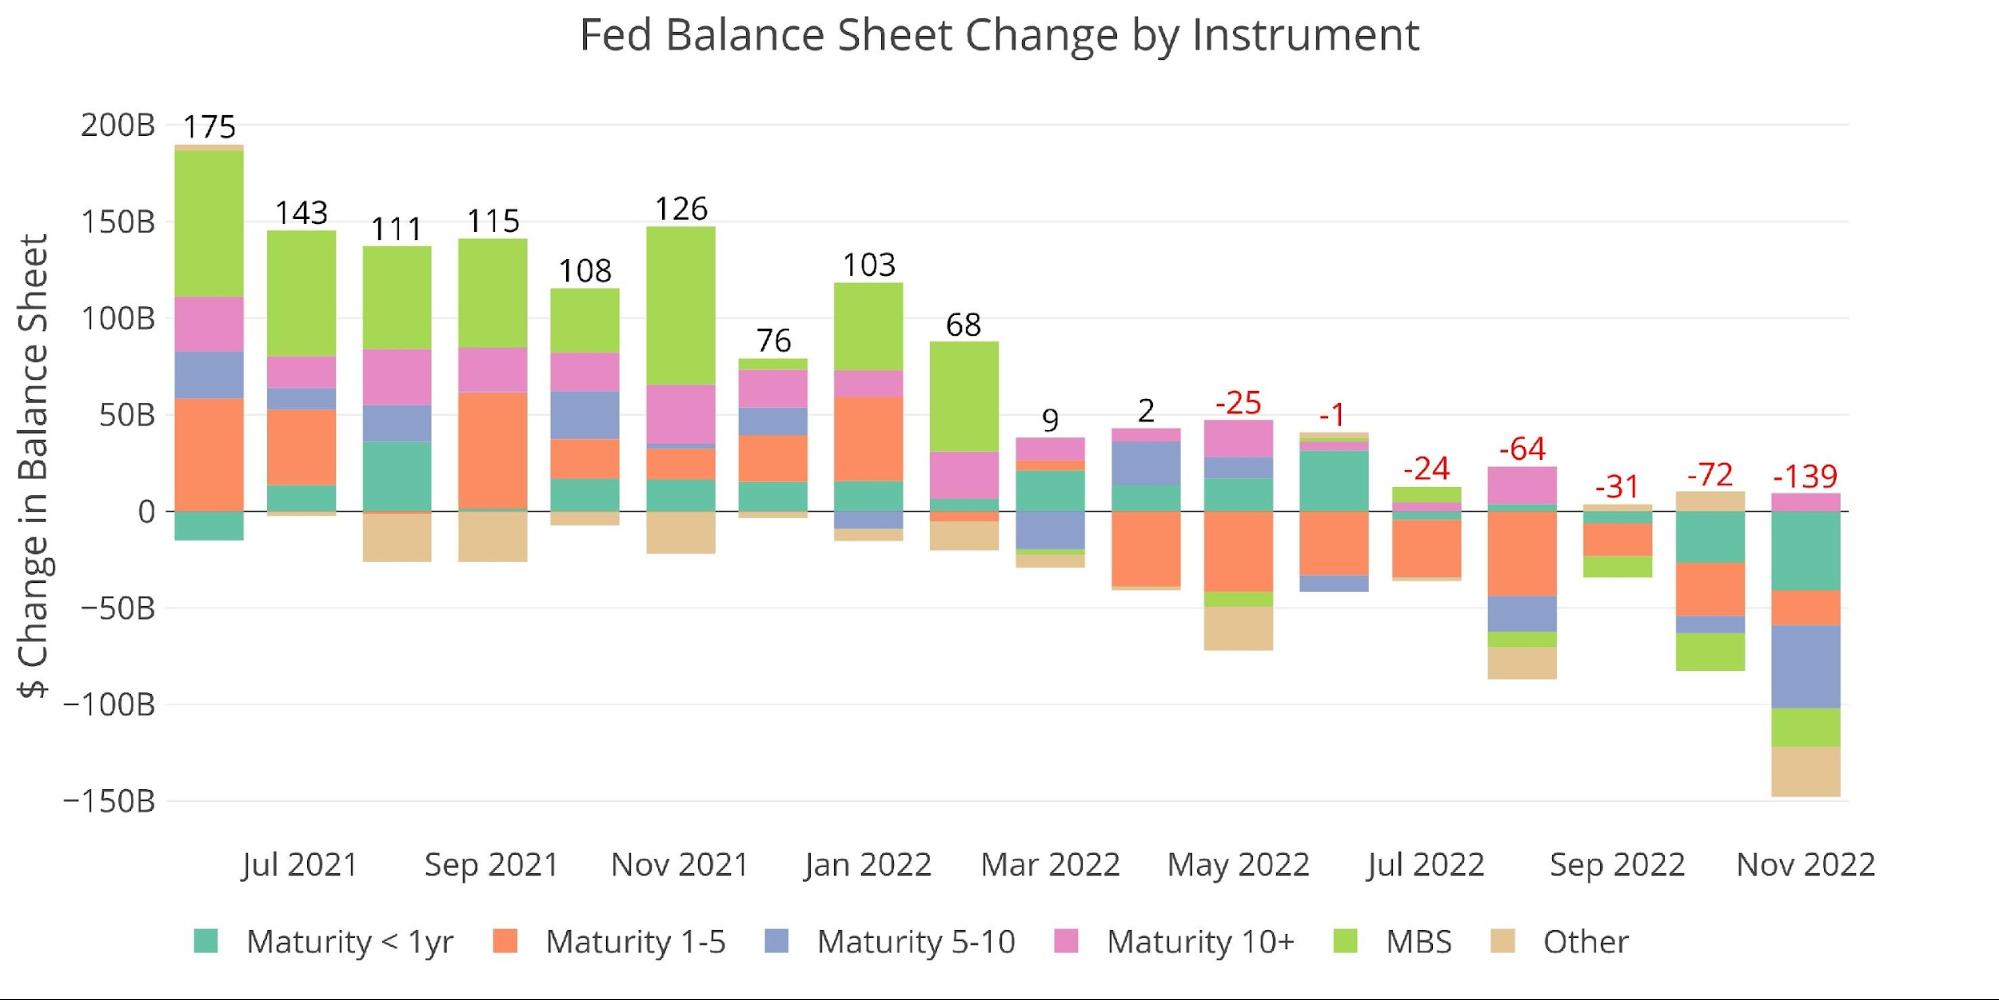
Figure: 1 Monthly Change by Instrument
The table below details the movement for the month:
-
- The Treasury market saw reductions across all maturities except 10+ years
-
- The total Treasury reduction was $100B vs a $65B target
-
- MBS fell short of the $37.5B target by $11.5B
-
- The Fed has much more trouble reducing MBS and has still not come close to their target for a single month
-
- The Treasury market saw reductions across all maturities except 10+ years
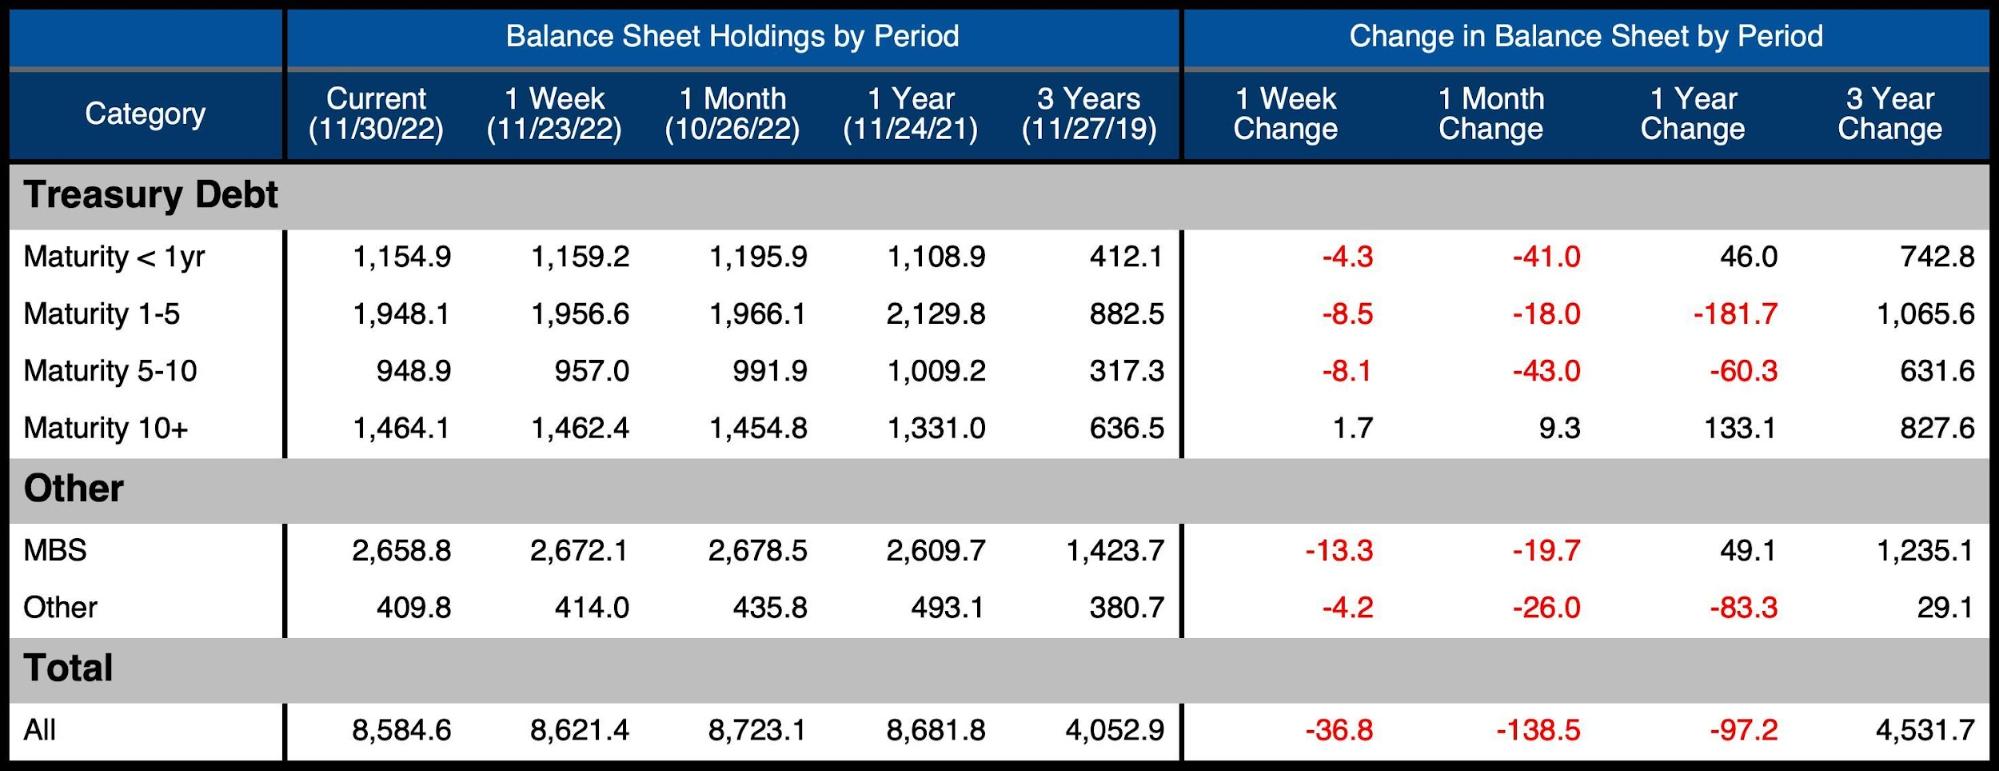
Figure: 2 Balance Sheet Breakdown
Looking at the weekly data shows that there was a massive draw down three weeks ago in < 1 year and 5-10 year maturities. This happened on the week of Nov 16 which was right after the big drop in interest rates. This helped reduce the loss the Fed took on the bonds it was selling.
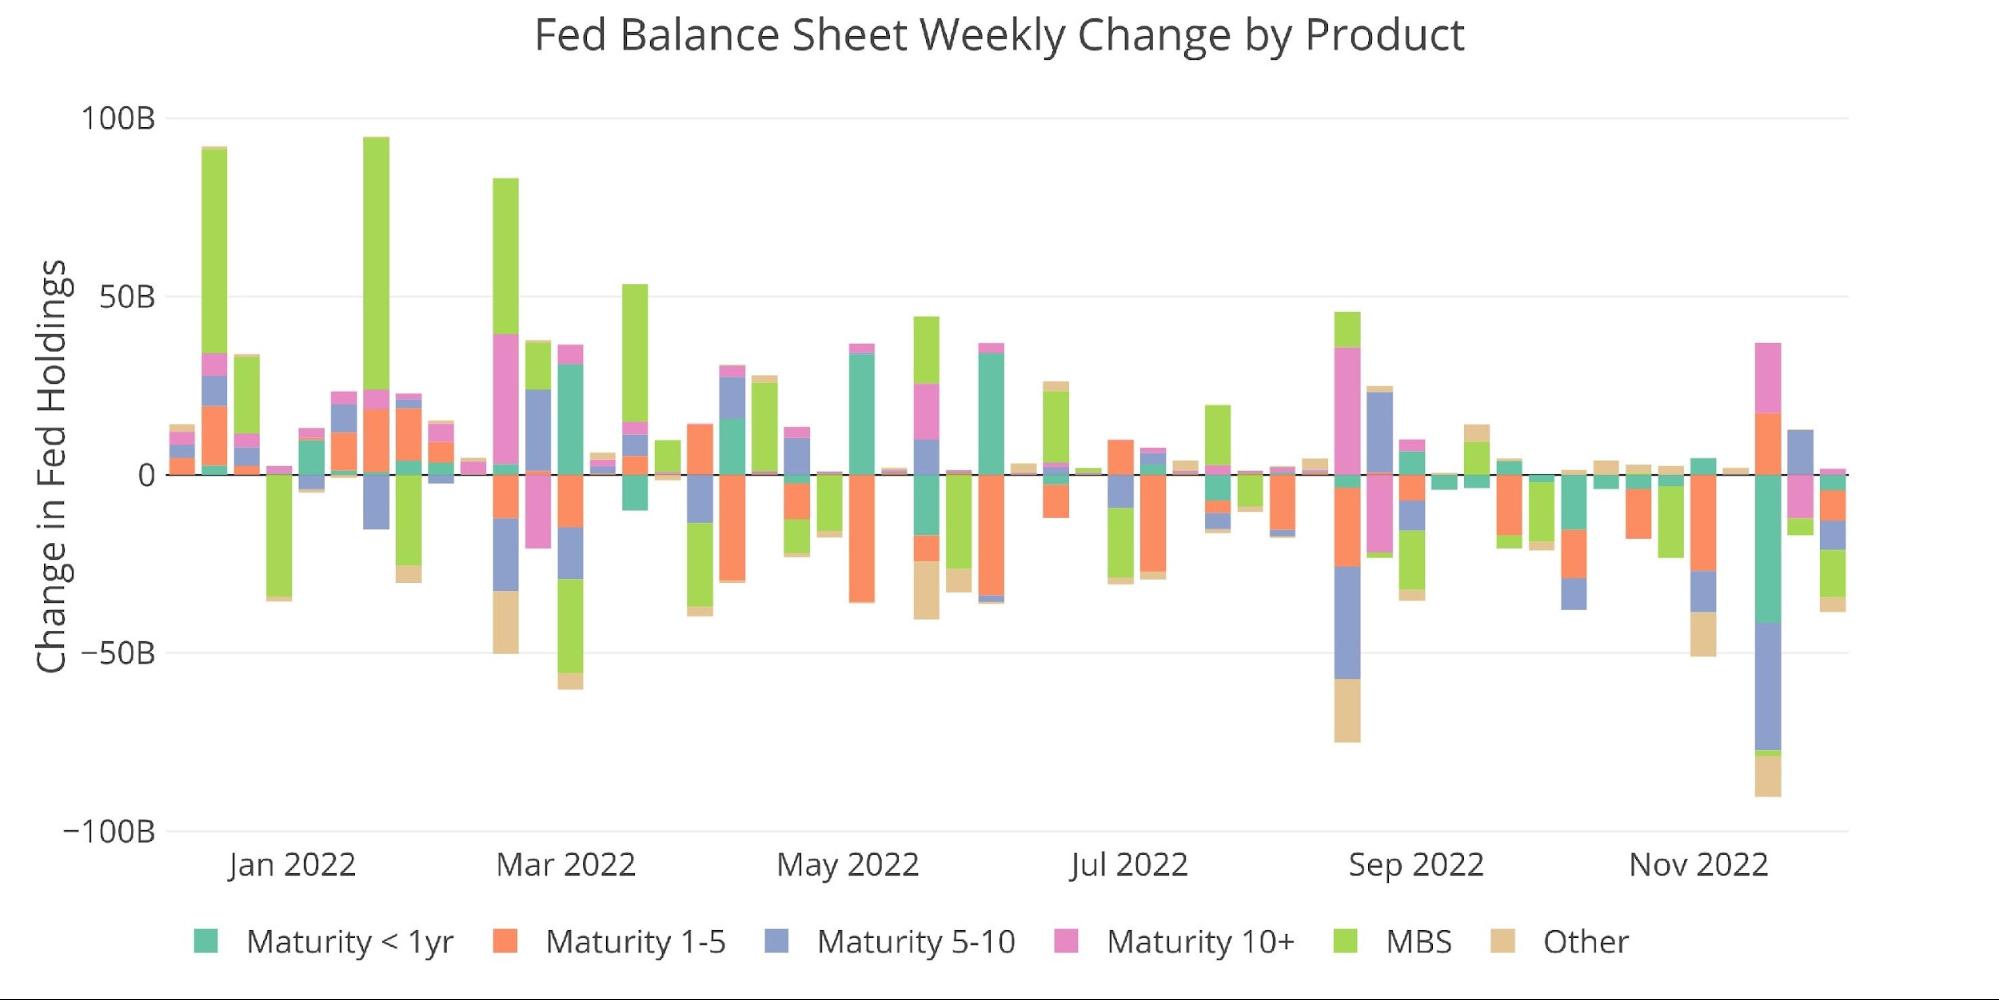
Figure: 3 Fed Balance Sheet Weekly Changes
As the Fed continues to miss on the MBS reduction, the overall portfolio allocation of MBS has grown. MBS now makes up 31% of the total balance sheet, up from 29.7% one year ago.
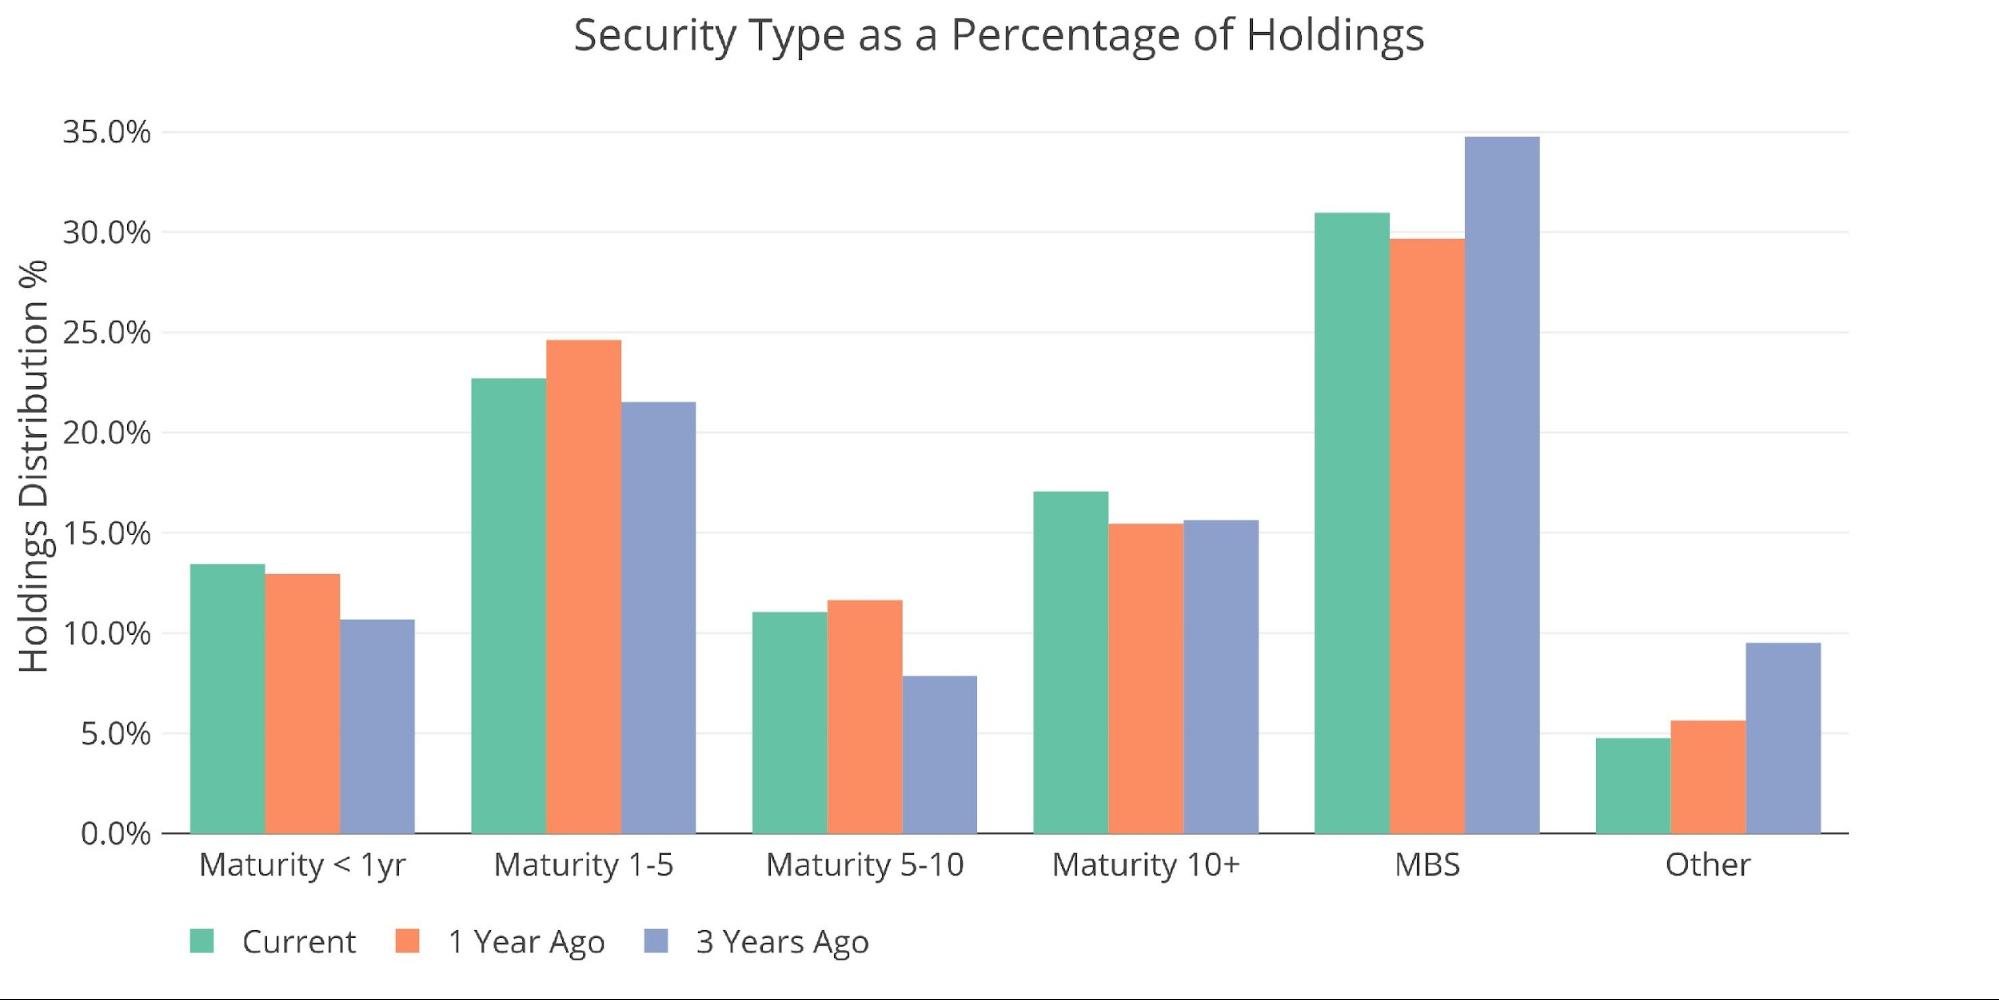
Figure: 4 Total Debt Outstanding
A lost Revenue Source for the Treasury
When the Fed makes money, it sends the Treasury a check. This has been quite substantial over the years, totaling $109B in 2021 and $87B in 2020. That time has come to the end, at least for now. The Fed lost $48B in November on the heels of losing $18.5B in October.
According to Reuters, the Fed has been warning about this possibility for some time. It should be noted, the Fed will not send the Treasury a bill to cover its losses. Instead, it will book the losses into a deficit account that will be held until the Fed makes enough money to make up for its losses.
Making up the losses could be years away, which means the Treasury has just lost a major source of extra revenue. This will only make future Treasury deficits worse.
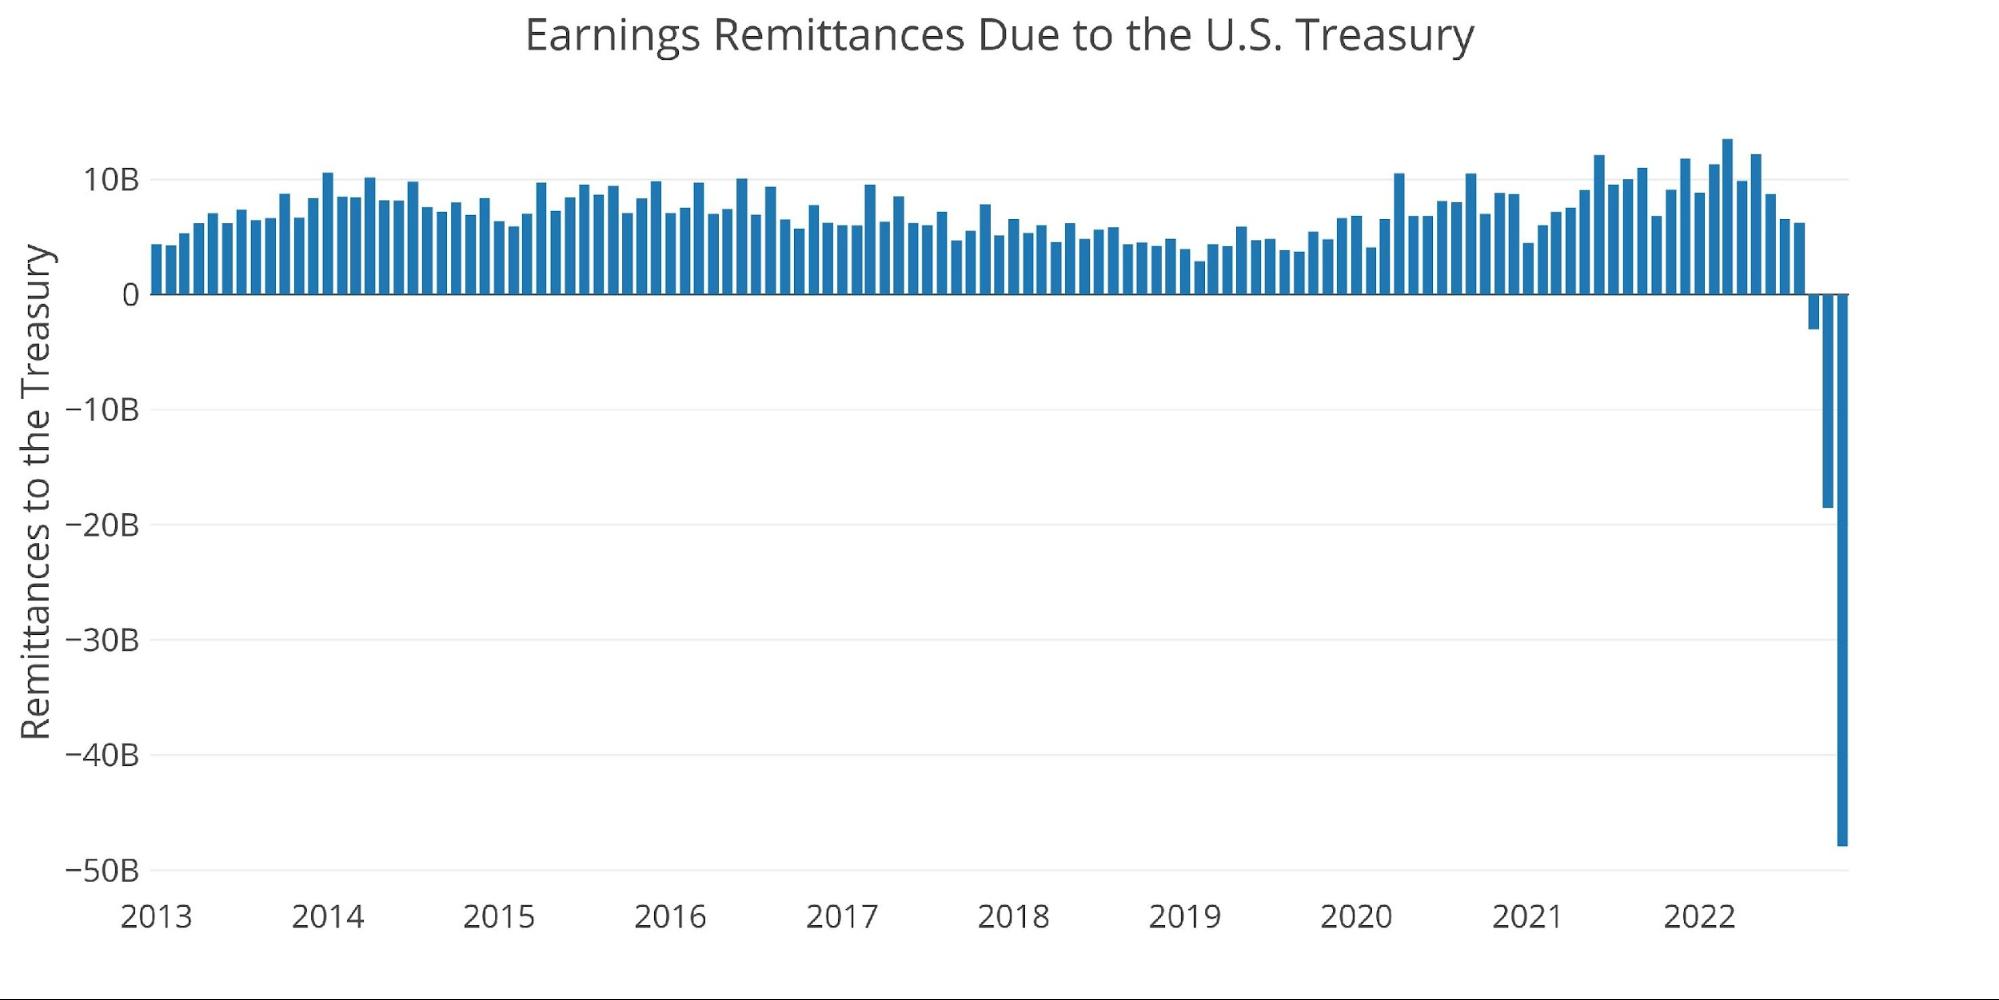
Figure: 5 Fed Payments to Treasury
The Fed is losing money because it pays financial firms for keeping assets on the Fed books. As interest rates have risen, the amount it pays out has also risen. It also loses money when it buys bonds at high prices and sells them at low prices, which is what has unfolded with QE and QT. As the chart below shows, interest rates have risen dramatically in recent months, despite the recent pullback.
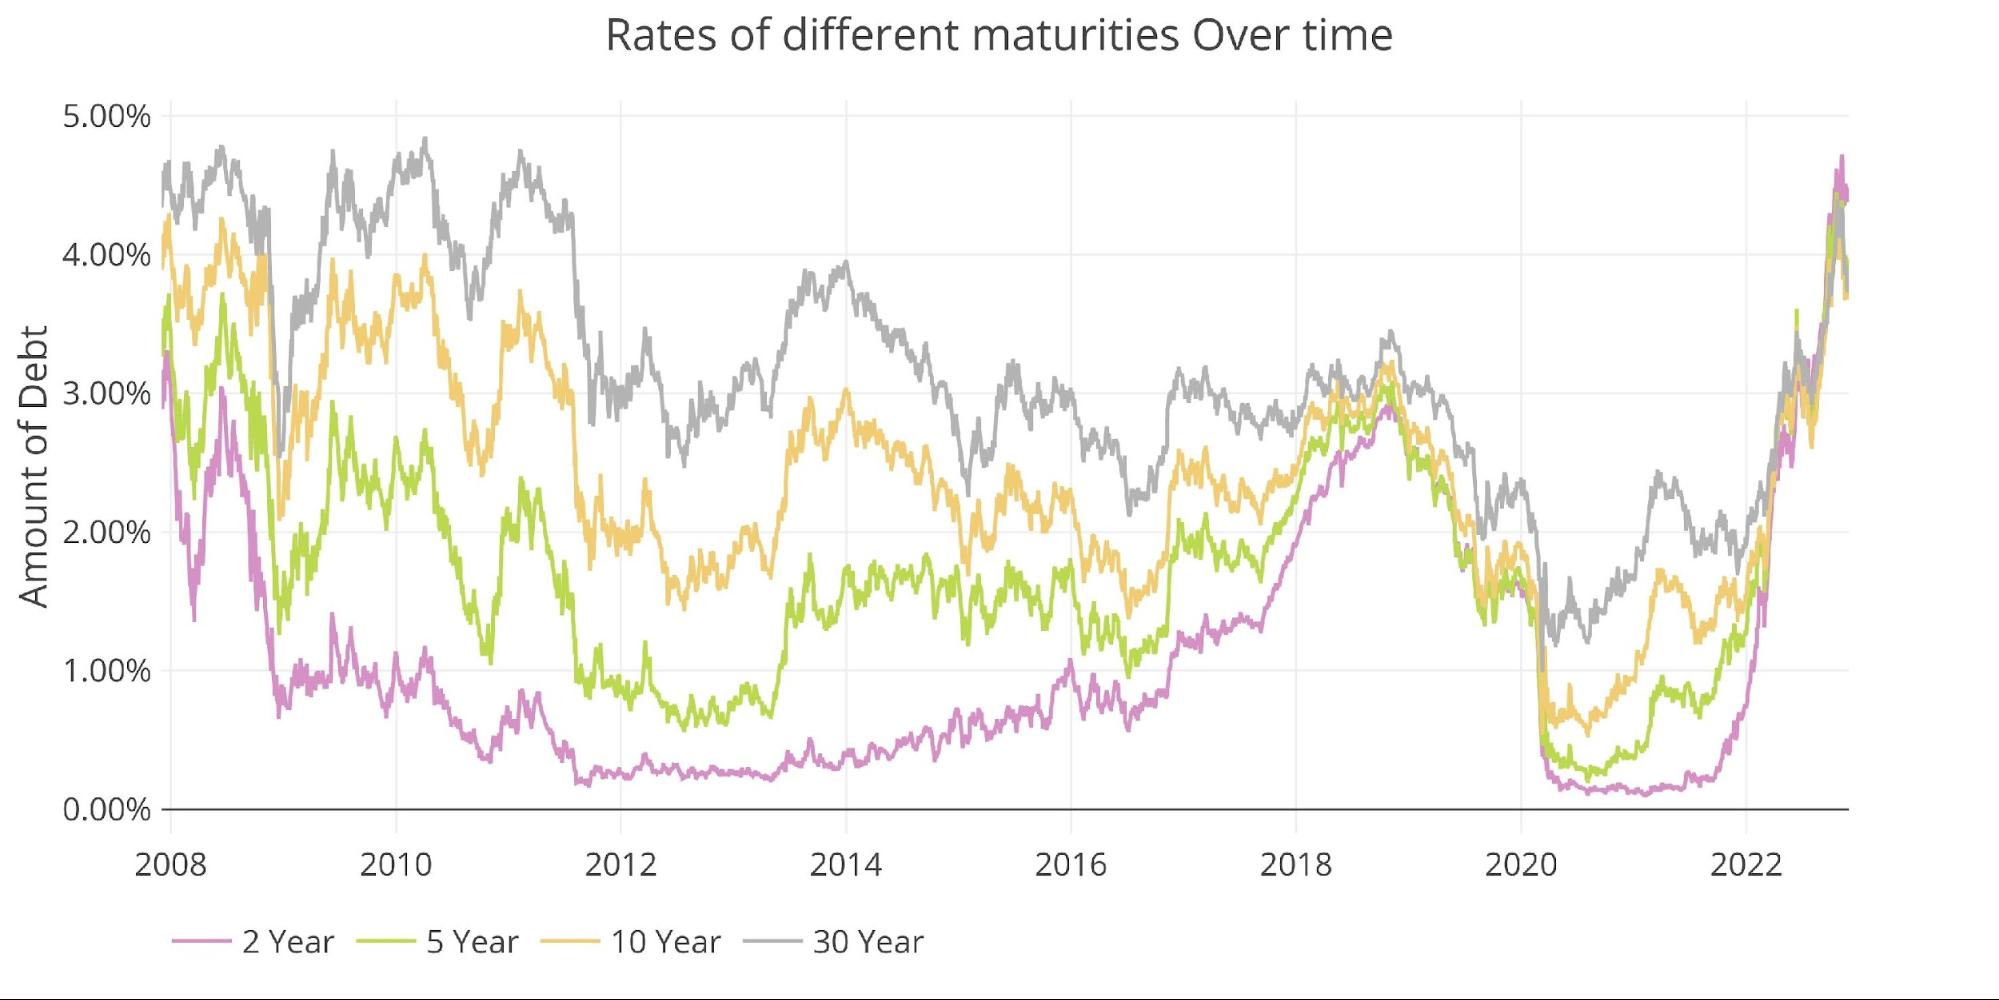
Figure: 6 Interest Rates Across Maturities
Short-term rates are rising even faster than long-term rates which have created the most inverted yield curve in more than 20 years. This can be seen below.
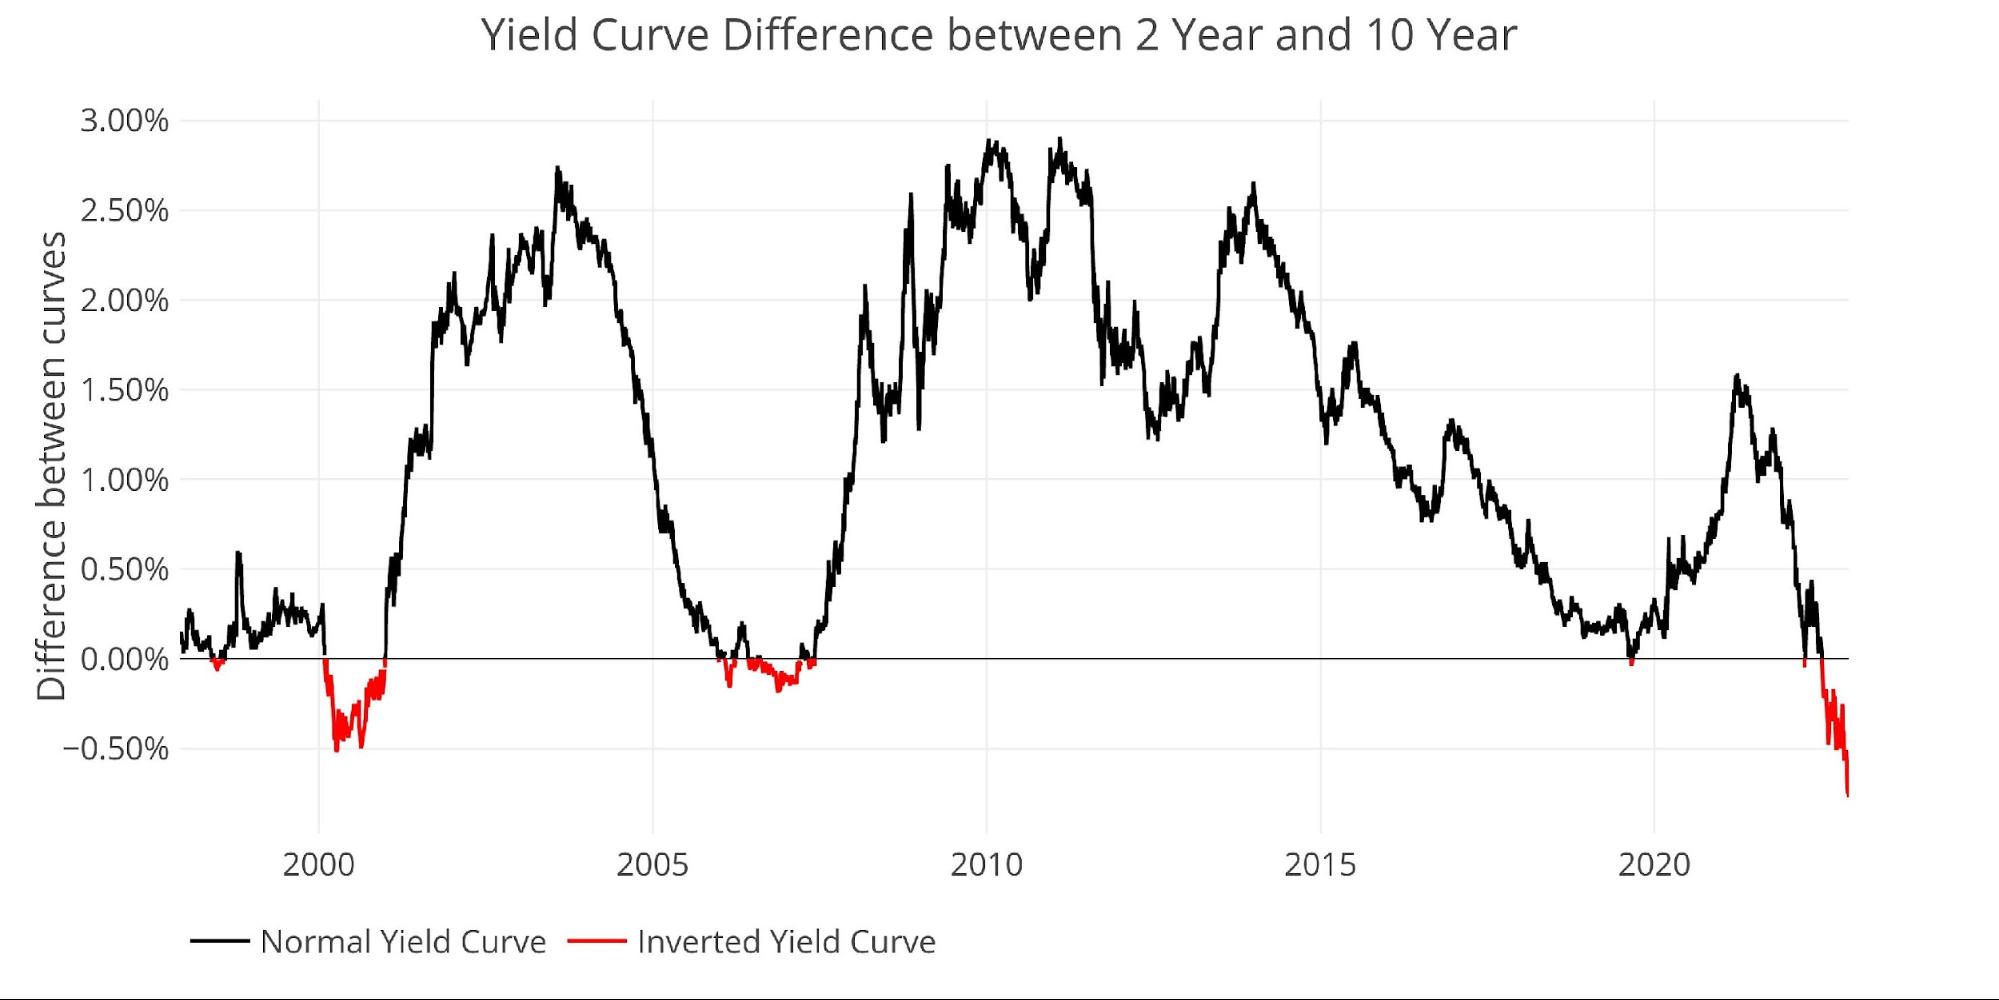
Figure: 7 Tracking Yield Curve Inversion
The chart below compares the yield curve at three points in time (current, 1 month ago, and 1 year ago). It’s easy to see how dramatically different the yield curve looks compared to last year and is also much more inverted than it was even a month ago.
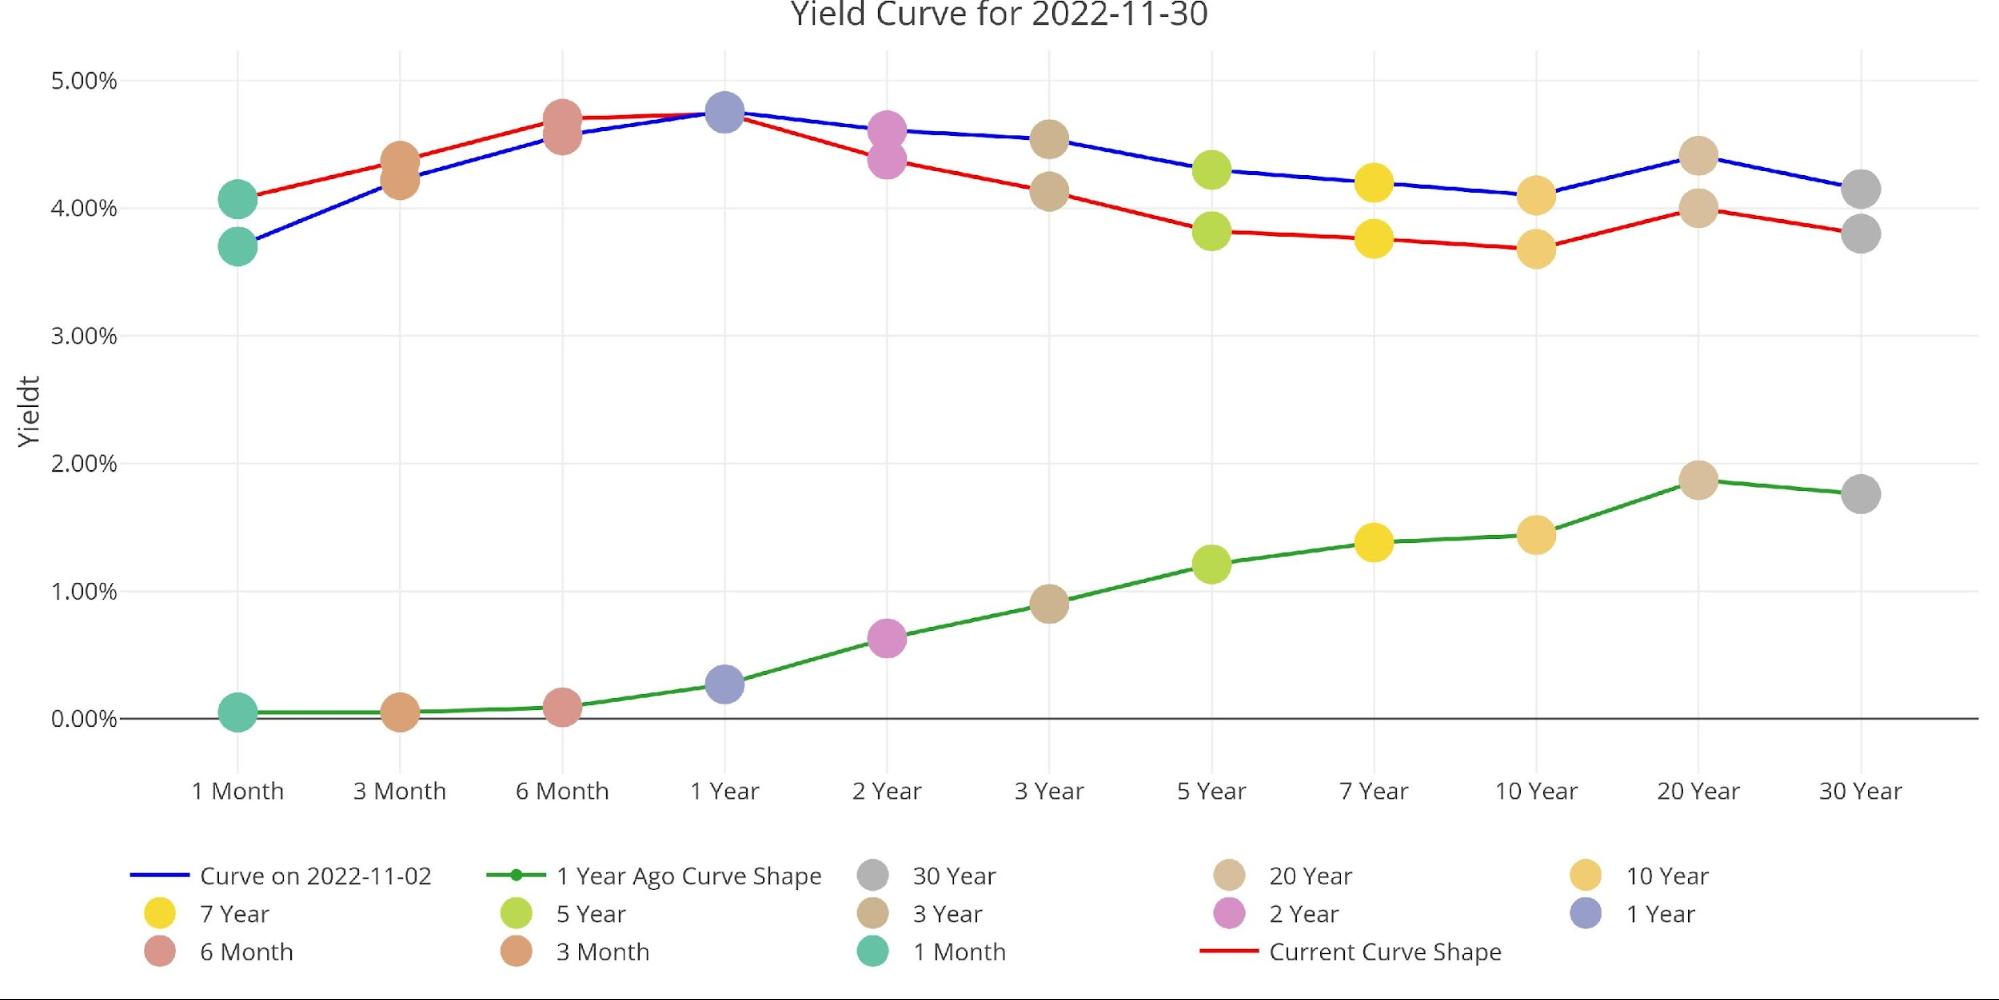
Figure: 8 Tracking Yield Curve Inversion
Who Will Fill the Gap?
Bloomberg recently published an article that shows how the typical Treasury buyers have all stepped back from the market. First and foremost, this includes the Fed which has been the biggest buyer in the market for two years. It also includes institutional investors and foreign countries.
As shown below, the international holders have completely stopped buying and have reduced holdings. Total international holdings are at $7.3T, down from $7.85T less than 1 year ago.
Note: data was last published in September
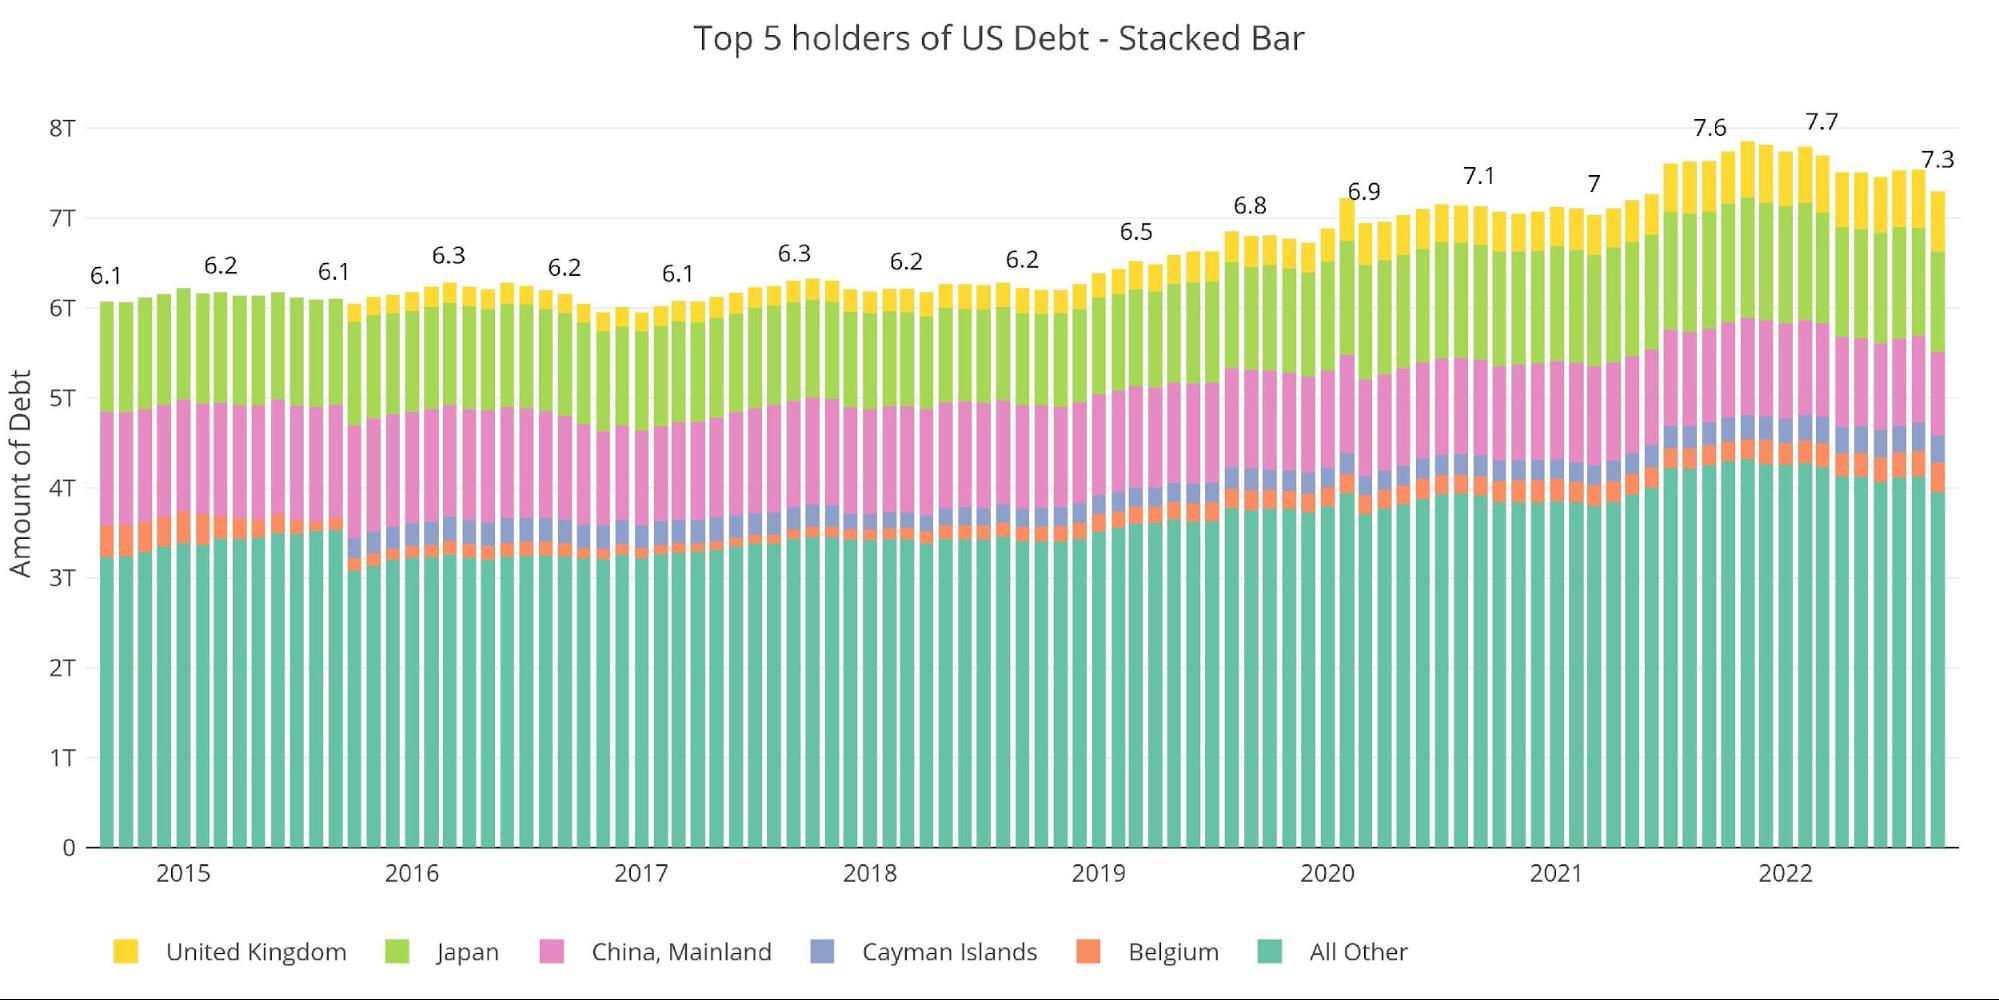
Figure: 9 International Holders
The table below shows how debt holding has changed since 2015 across different borrowers. The net change over the last year is a reduction of $340B. The bigger area of concern though is that China and Japan are down a combined $300B. Behind the Fed, China and Japan had been some of the biggest buyers. Not anymore!

Figure: 10 Average Weekly Change in the Balance Sheet
Historical Perspective
The final plot below takes a larger view of the balance sheet. It is clear to see how the usage of the balance sheet has changed since the Global Financial Crisis. The tapering from 2017-2019 can be seen in the slight dip before the massive surge due to Covid. It’s highly unlikely the new round of QT will last as long or shrink the balance sheet as much as it did in 2018. Something will break before then.
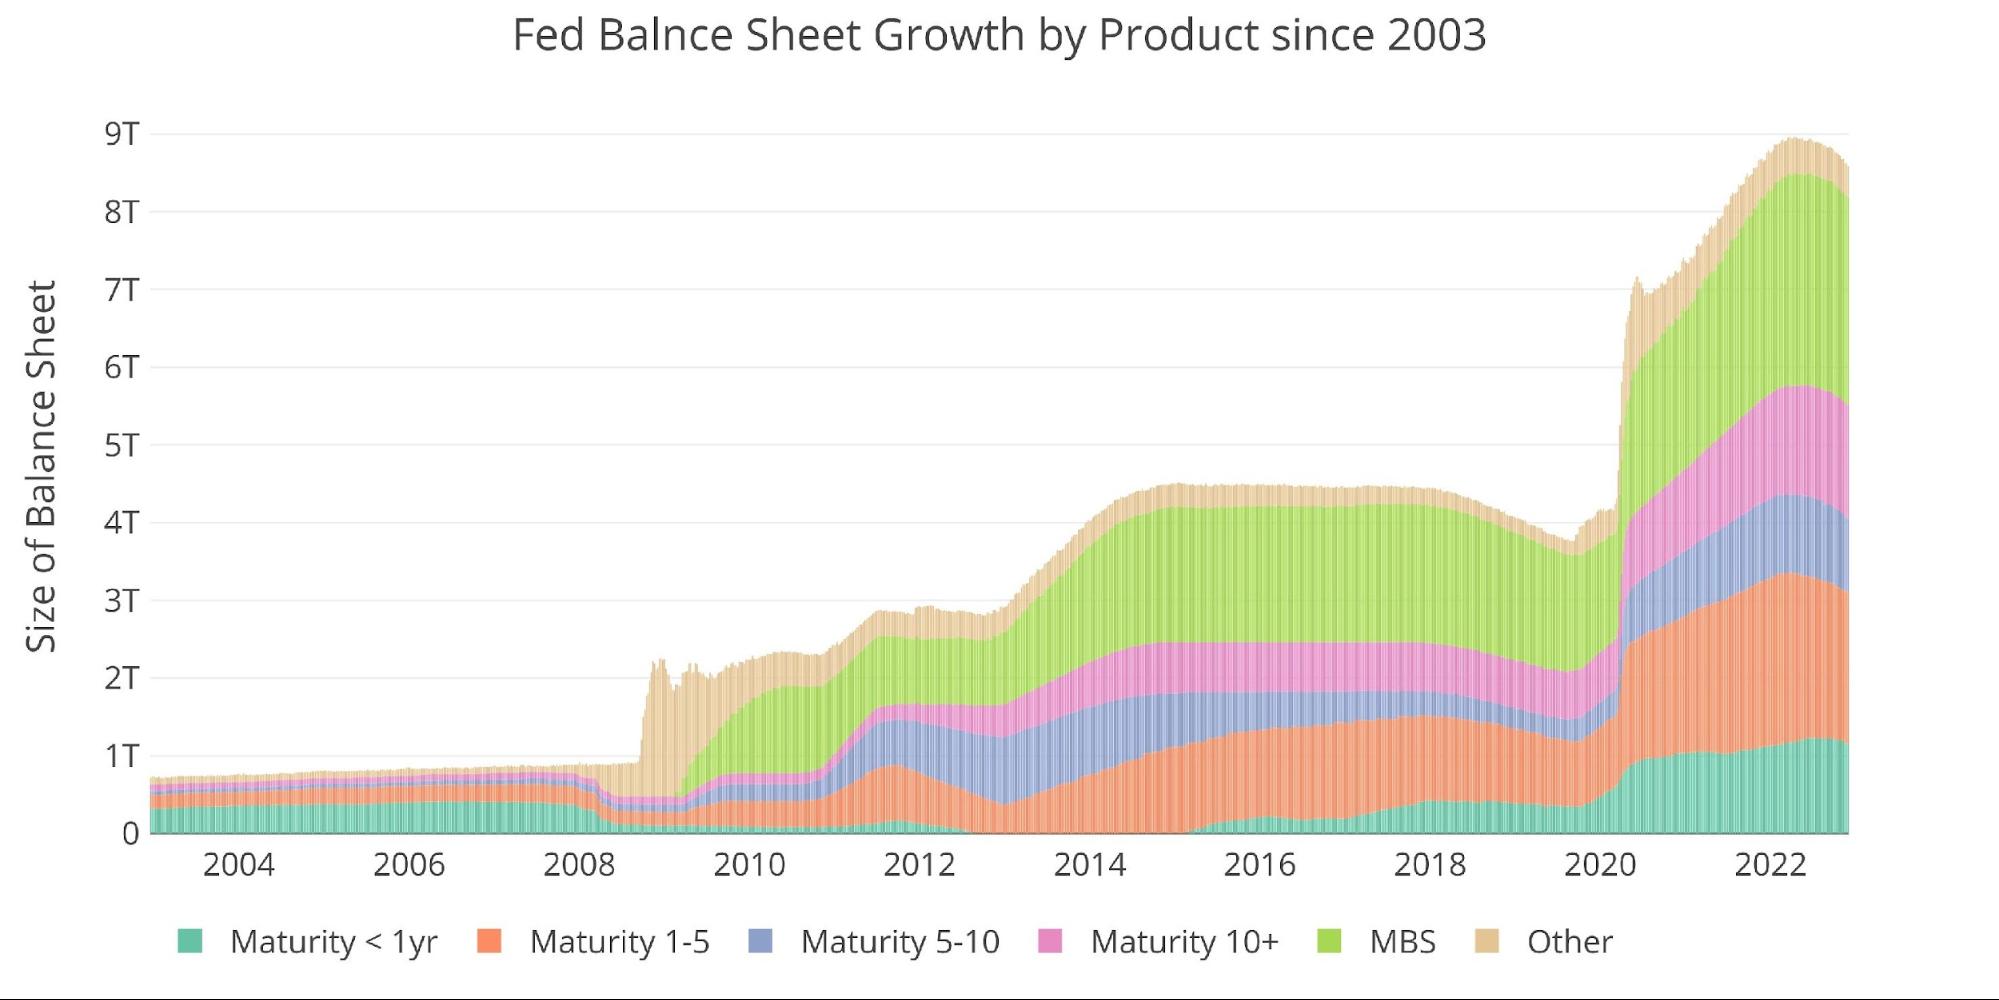
Figure: 11 Historical Fed Balance Sheet
What it means for Gold and Silver
Things are getting very tricky for the Fed. They don’t face any major risk by losing billions of dollars each month (lucky them), but it does give the Treasury one less source of revenue. The bigger issue is going to materialize in bond market liquidity. This could lead to an end of QT and may even prompt a return to QE to ensure smooth functioning of the bond market.
When the Fed returns to QE, it will likely send gold and silver soaring as the markets will finally wake up to the bluff the Fed has been making for almost a year now. Markets will probably see the pivot coming well before one is officially announced. This could explain the recent moves in gold and silver. Given the likely turmoil that lies ahead, both metals are probably just getting started in their bull runs.
Data Source: https://fred.stlouisfed.org/series/WALCL and https://fred.stlouisfed.org/release/tables?rid=20&eid=840849#snid=840941
Data Updated: Weekly, Thursday at 4:30 PM Eastern
Last Updated: Nov 30, 2022
Interactive charts and graphs can always be found on the Exploring Finance dashboard: https://exploringfinance.shinyapps.io/USDebt/

Call 1-888-GOLD-160 and speak with a Precious Metals Specialist today!
Buka akaun dagangan patuh syariah anda di Weltrade.
Source link