
Please note: the CoTs report was published on 03/22/2024 for the period ending 03/19/2024. “Managed Money” and “Hedge Funds” are used interchangeably.
The Commitment of Traders report is a weekly publication that shows the breakdown of ownership in the Futures market. For every contract, there is a long and a short, so the net positioning will always be zero, but the report shows who is positioned long or short. Historically, Hedge Funds (Managed Money) dominate the price action in both Gold and Silver. That continues to be the case, but it’s possible that there could also be some Hedge Funds looking to stress the Comex by taking physical delivery.
Let’s take a quick look…
Gold
Current Trends
Below shows net positioning for the 5 main groups of futures holders. Net positioning is still lower than it was throughout most of 2020-2022. That is a good sign the market is not over-bought.
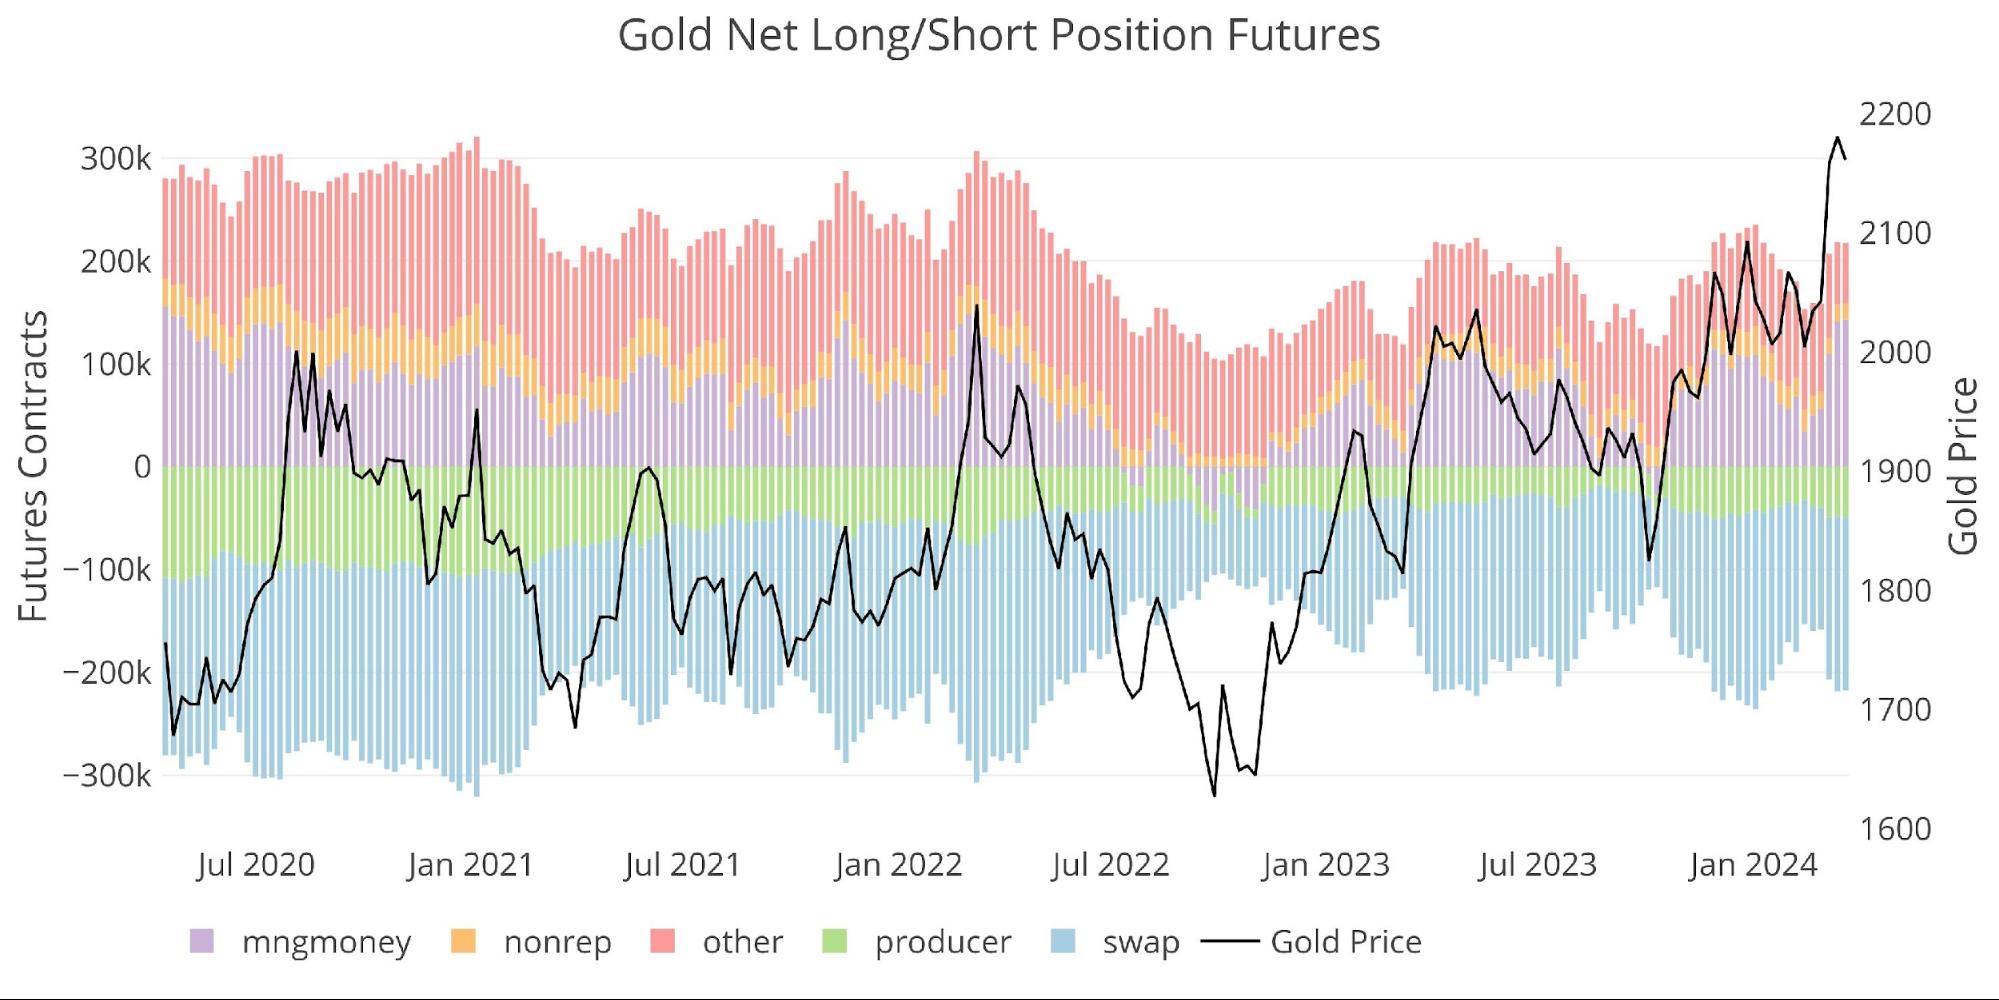
Figure: 1 Net Position by Holder
Managed Money is in complete control of the price action, driving prices higher in recent weeks.
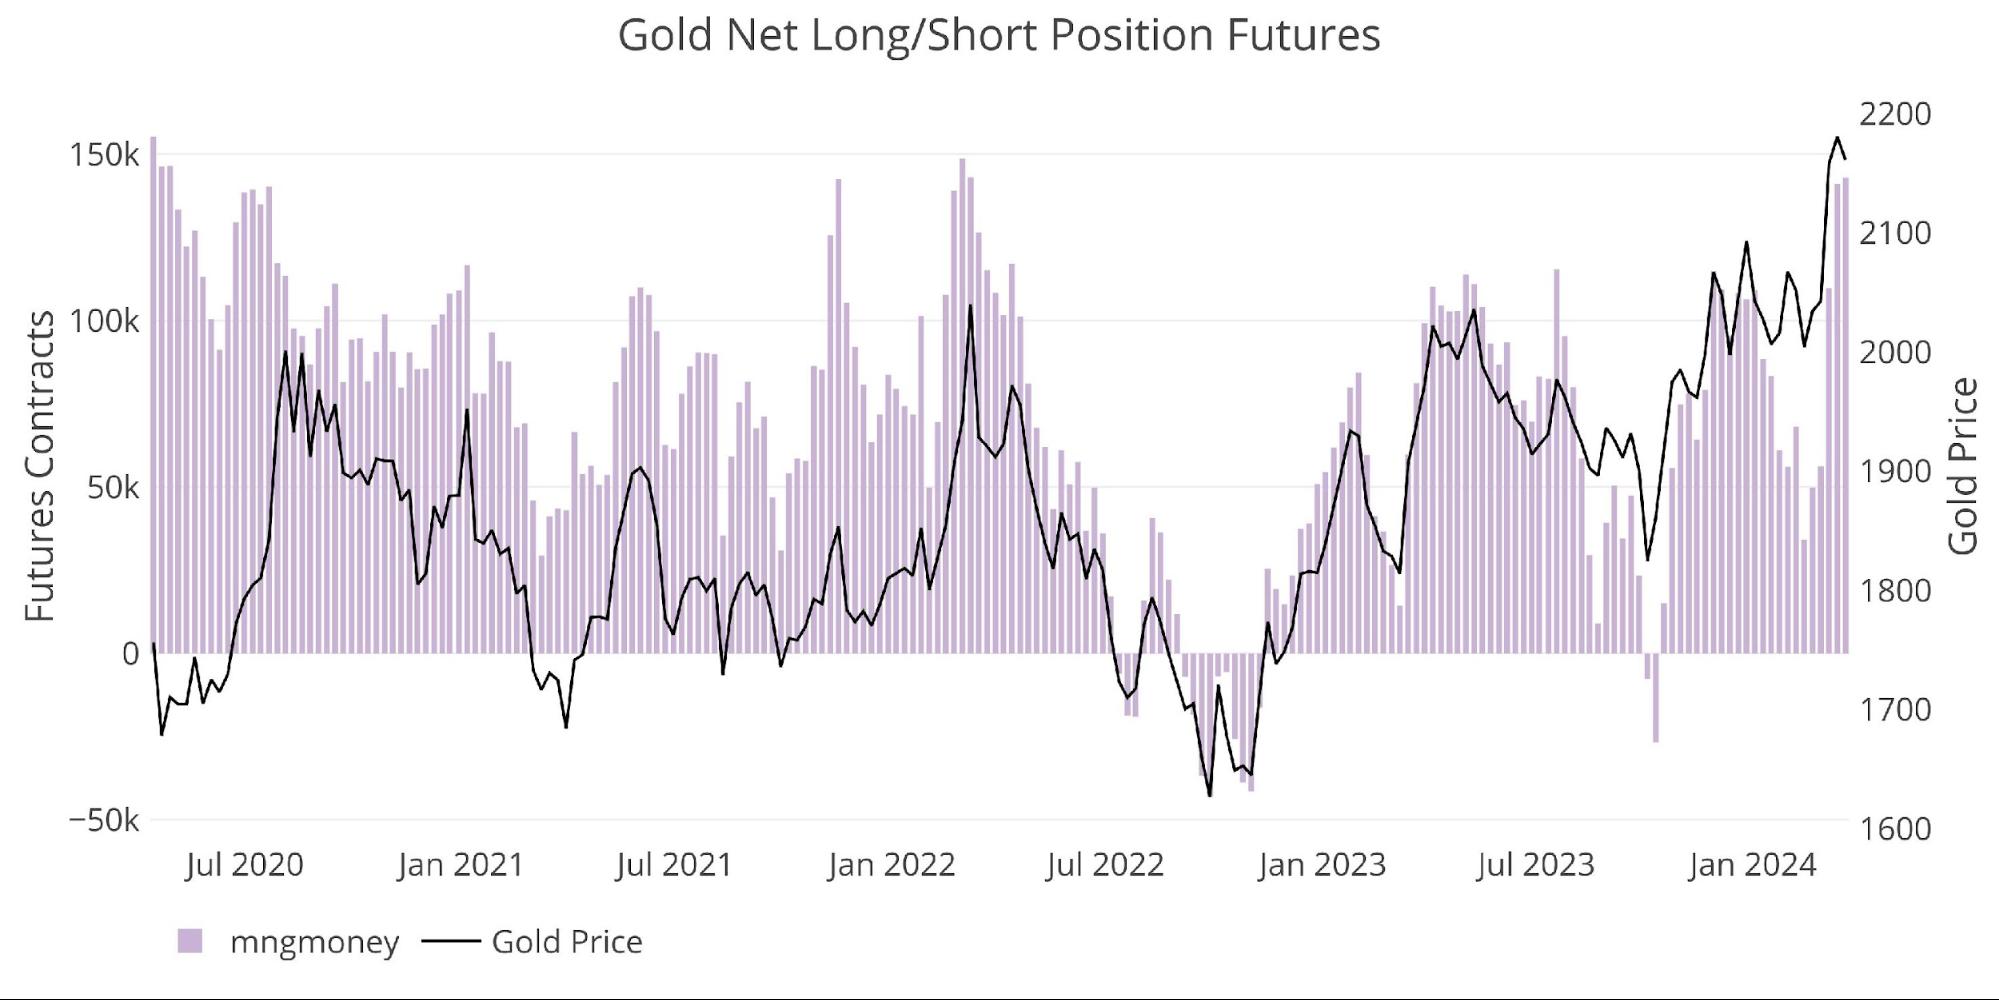
Figure: 2 Managed Money Net Position
Weekly Activity
They have taken very big long positions in the last two weeks.
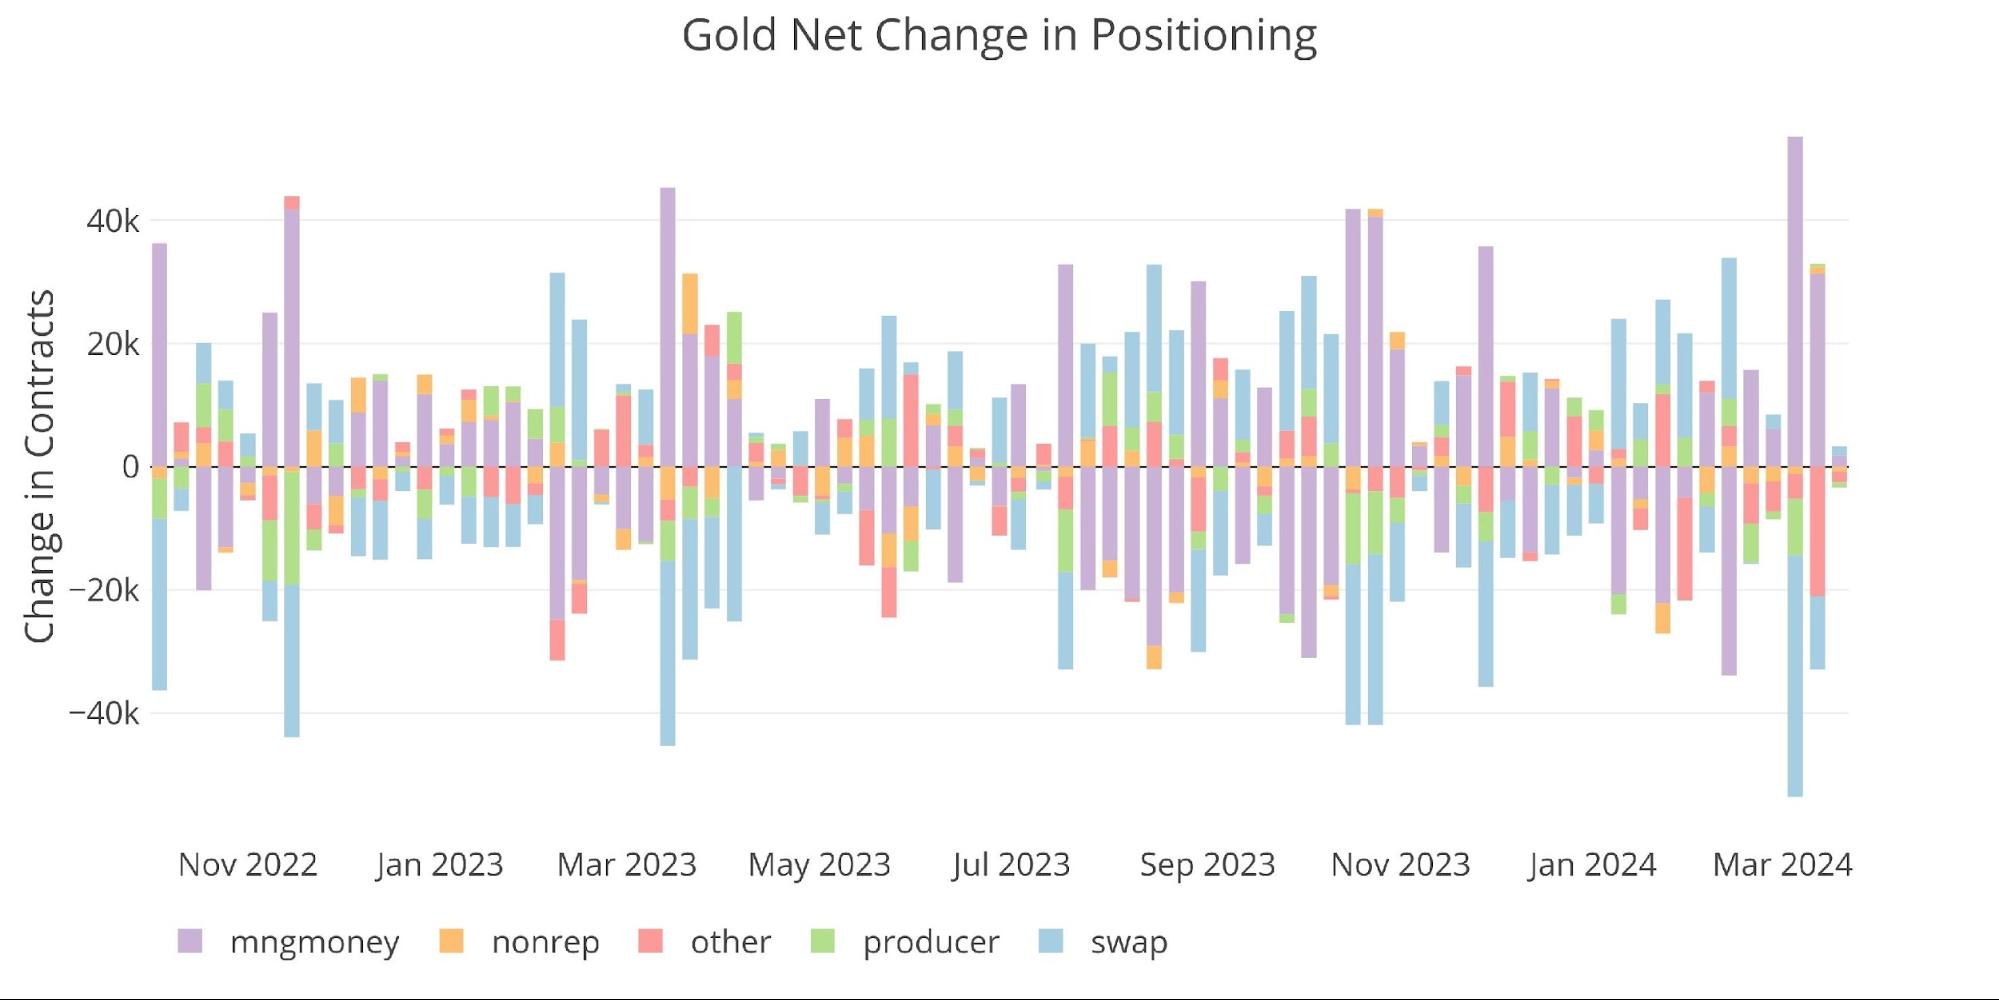
Figure: 3
The options market is also still within normal exposure levels despite the metal trading at record highs.
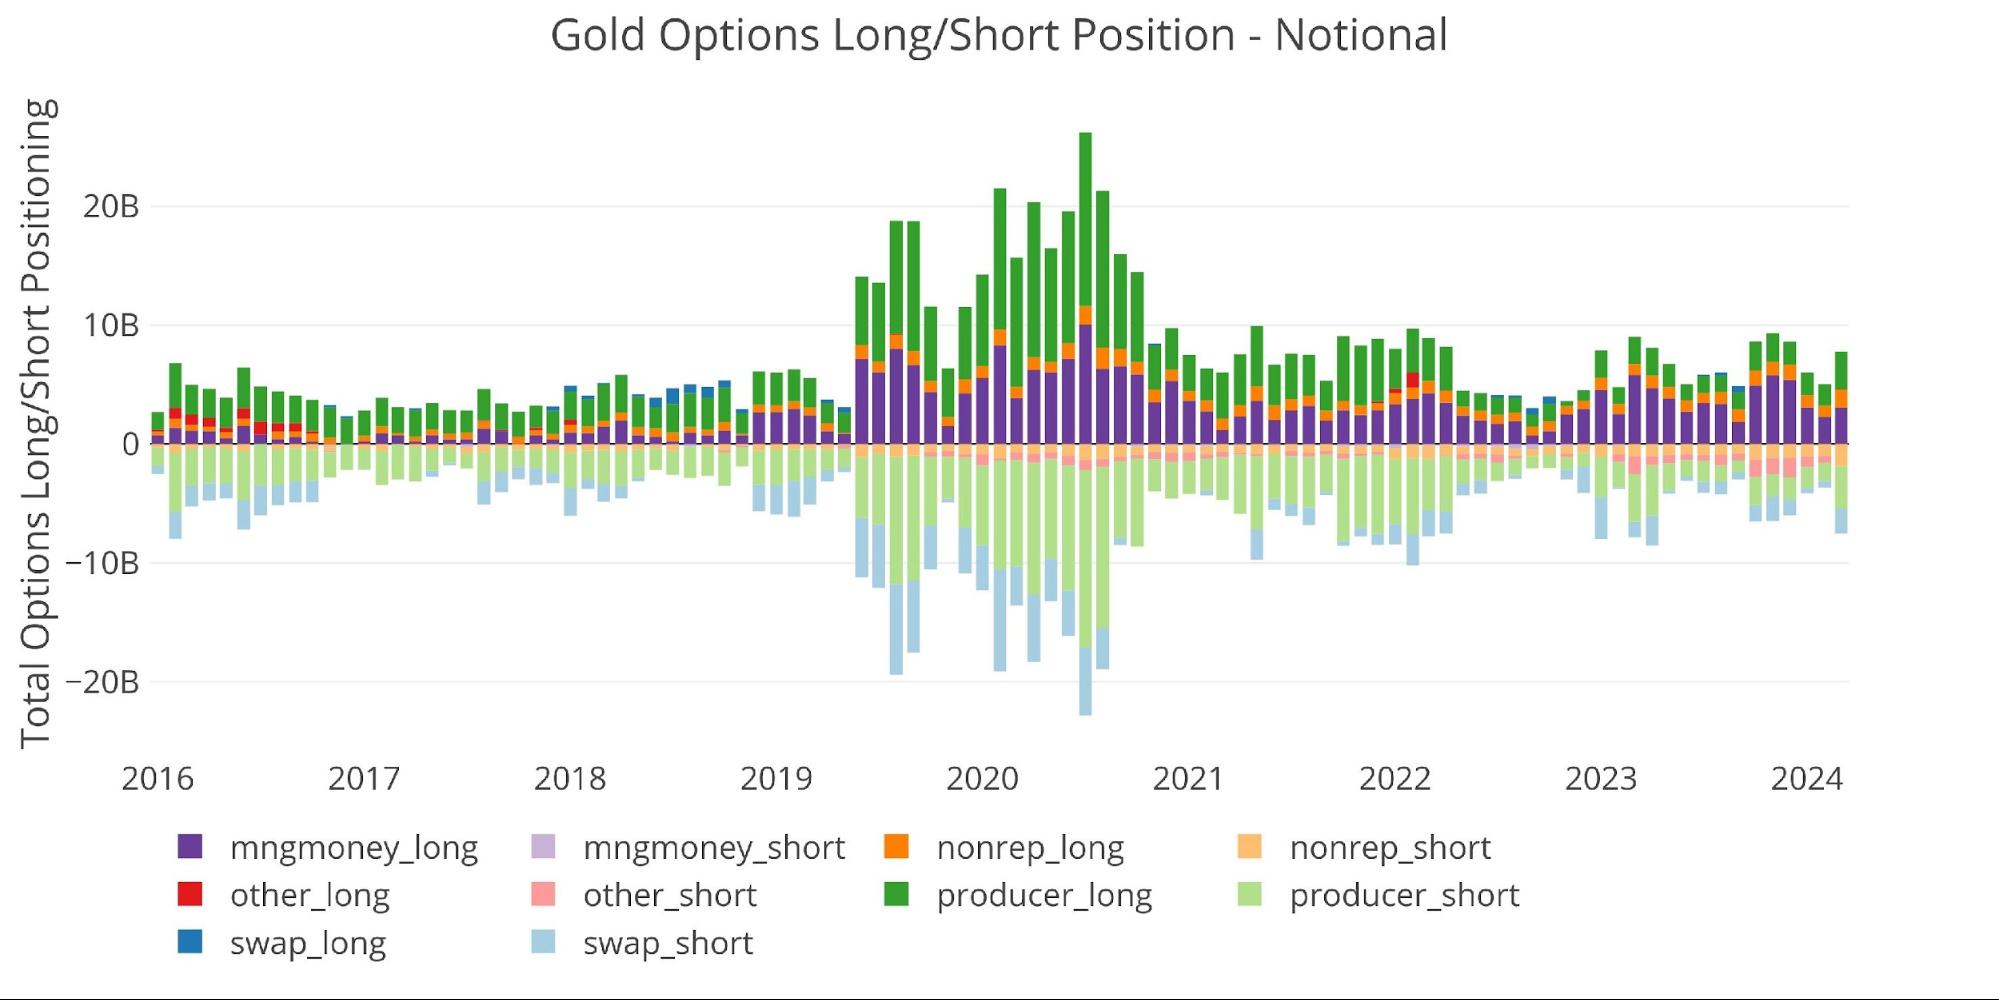
Figure: 4 Options Positions
Silver
Current Trends
Silver total net positioning has reached the highest point since March 2022 when the war in Ukraine broke out.
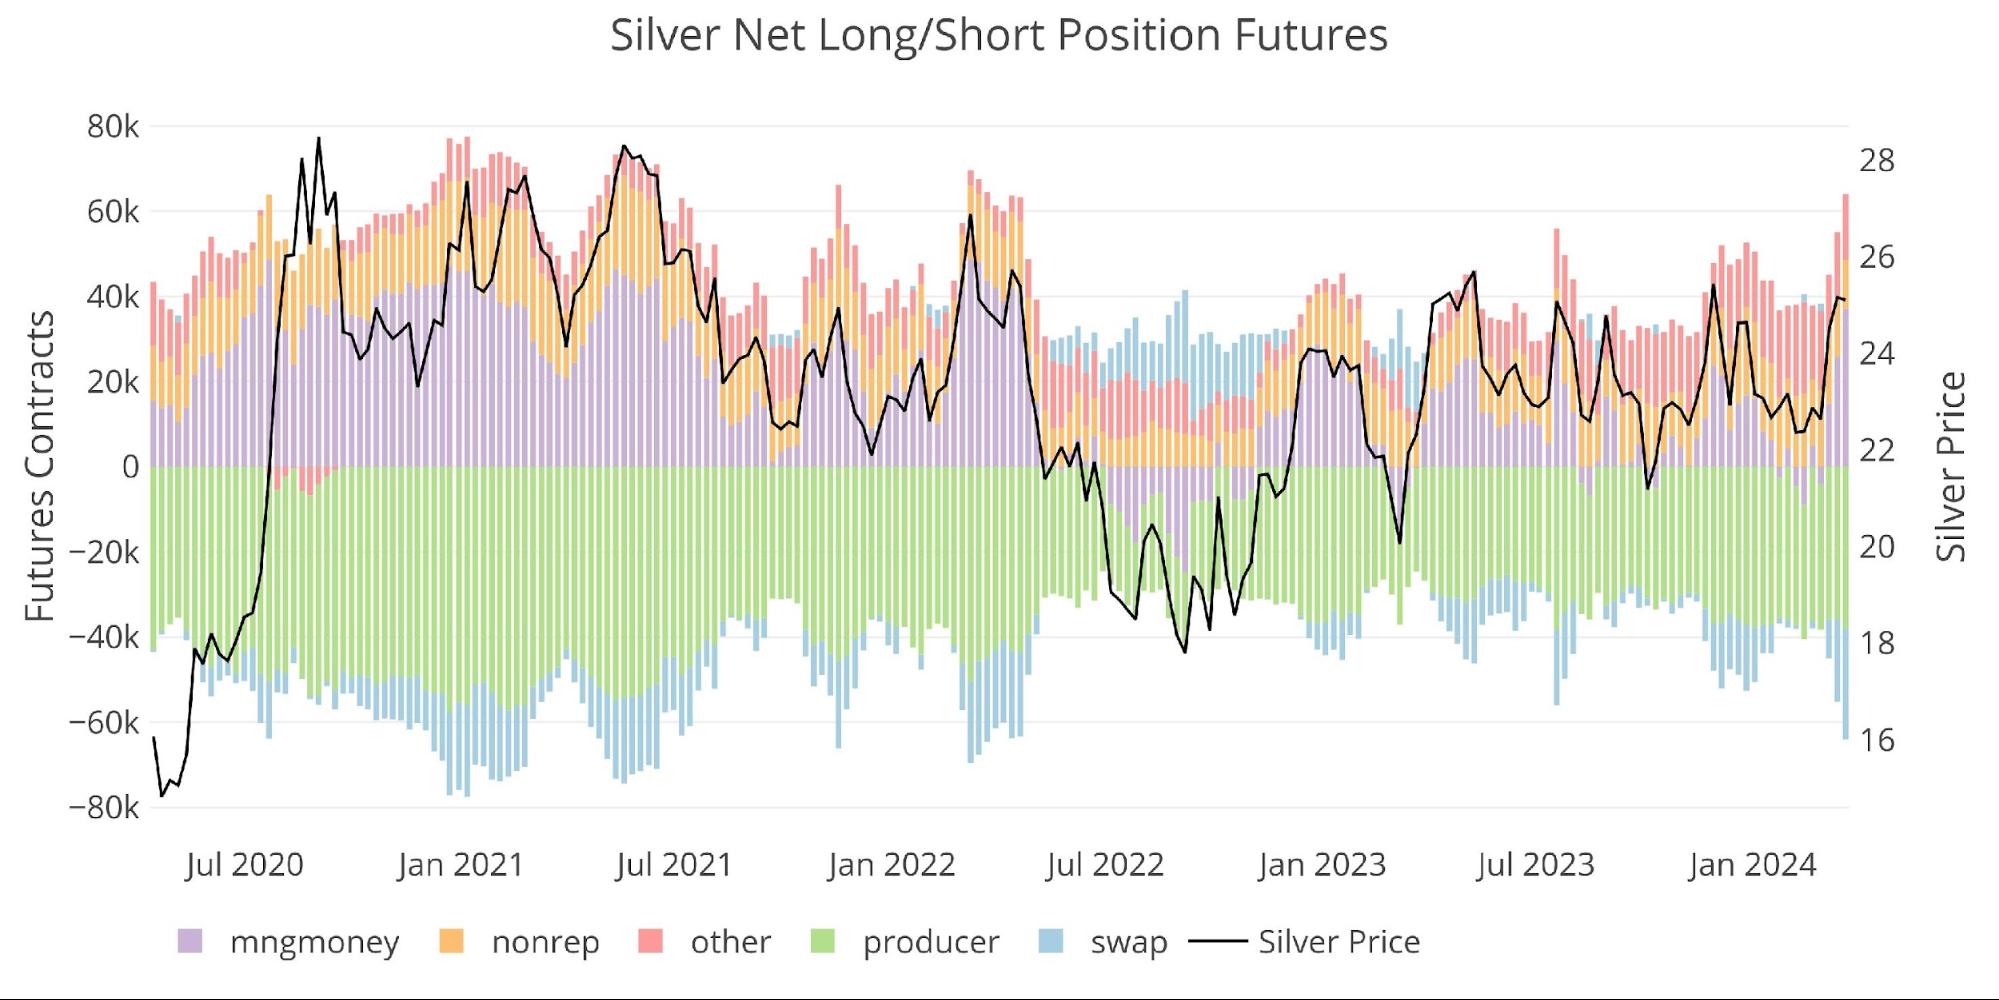
Figure: 5 Net Position by Holder
Just like gold, the price of Silver is overwhelmingly dominated by Managed Money positioning.
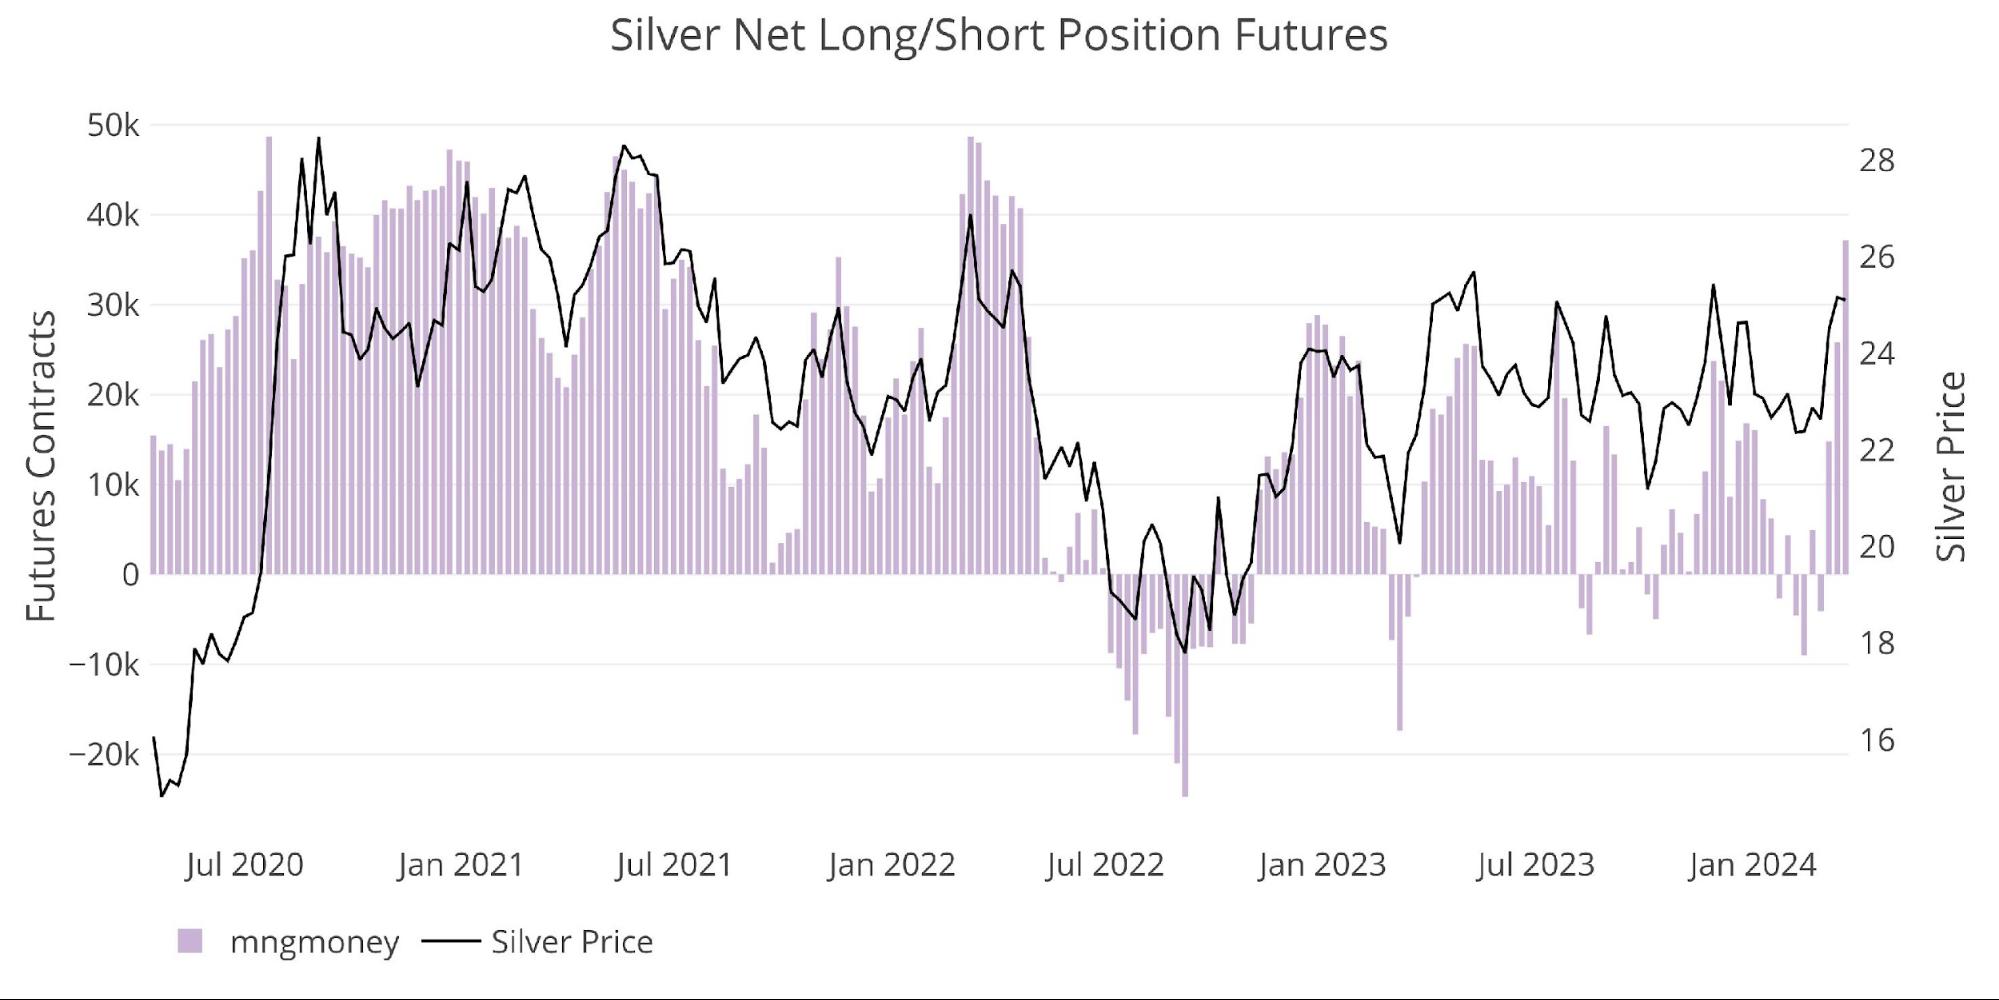
Figure: 6 Managed Money Net Position
Weekly Activity
Managed Money has been on a buying spree in recent weeks.
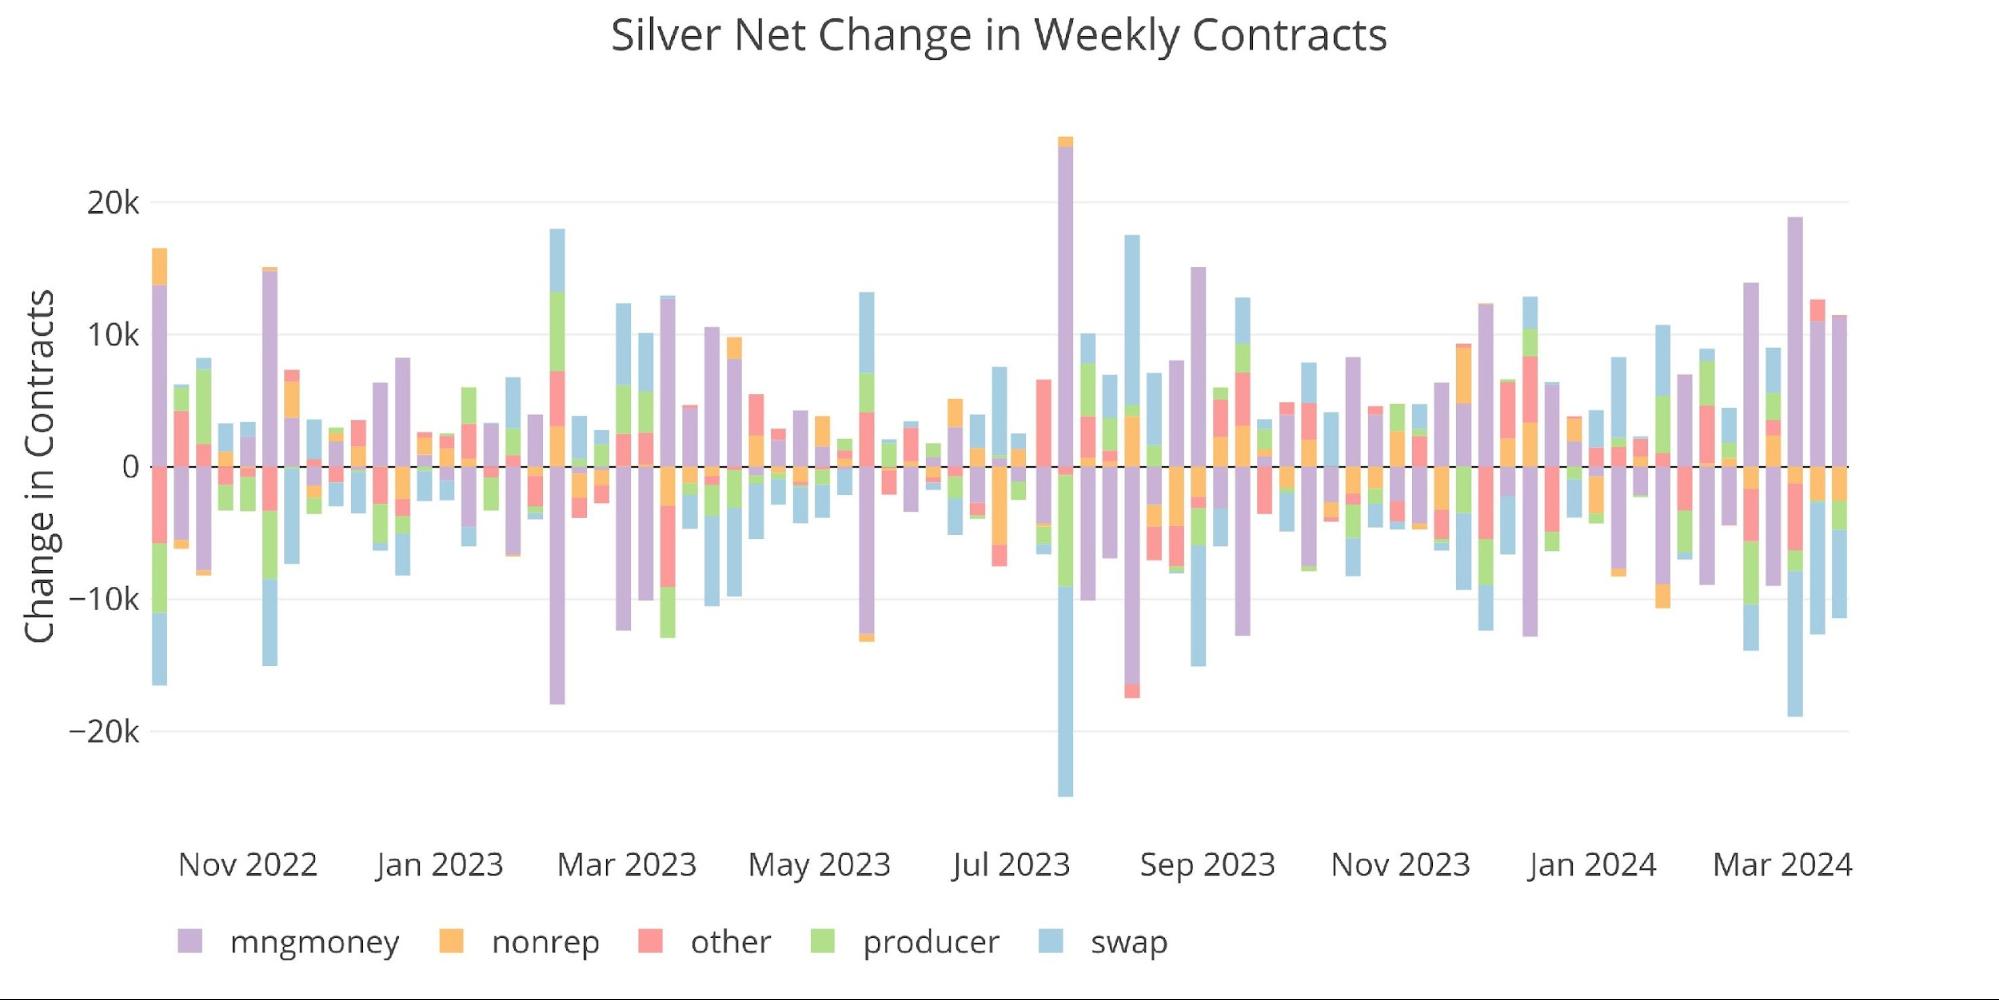
Figure: 7 Net Change in Positioning
The options market is also within a normal range, but well below the highs from 2011 when silver last approached an all-time high (Note: 2011 not pictured but notional values reached $2.8B).
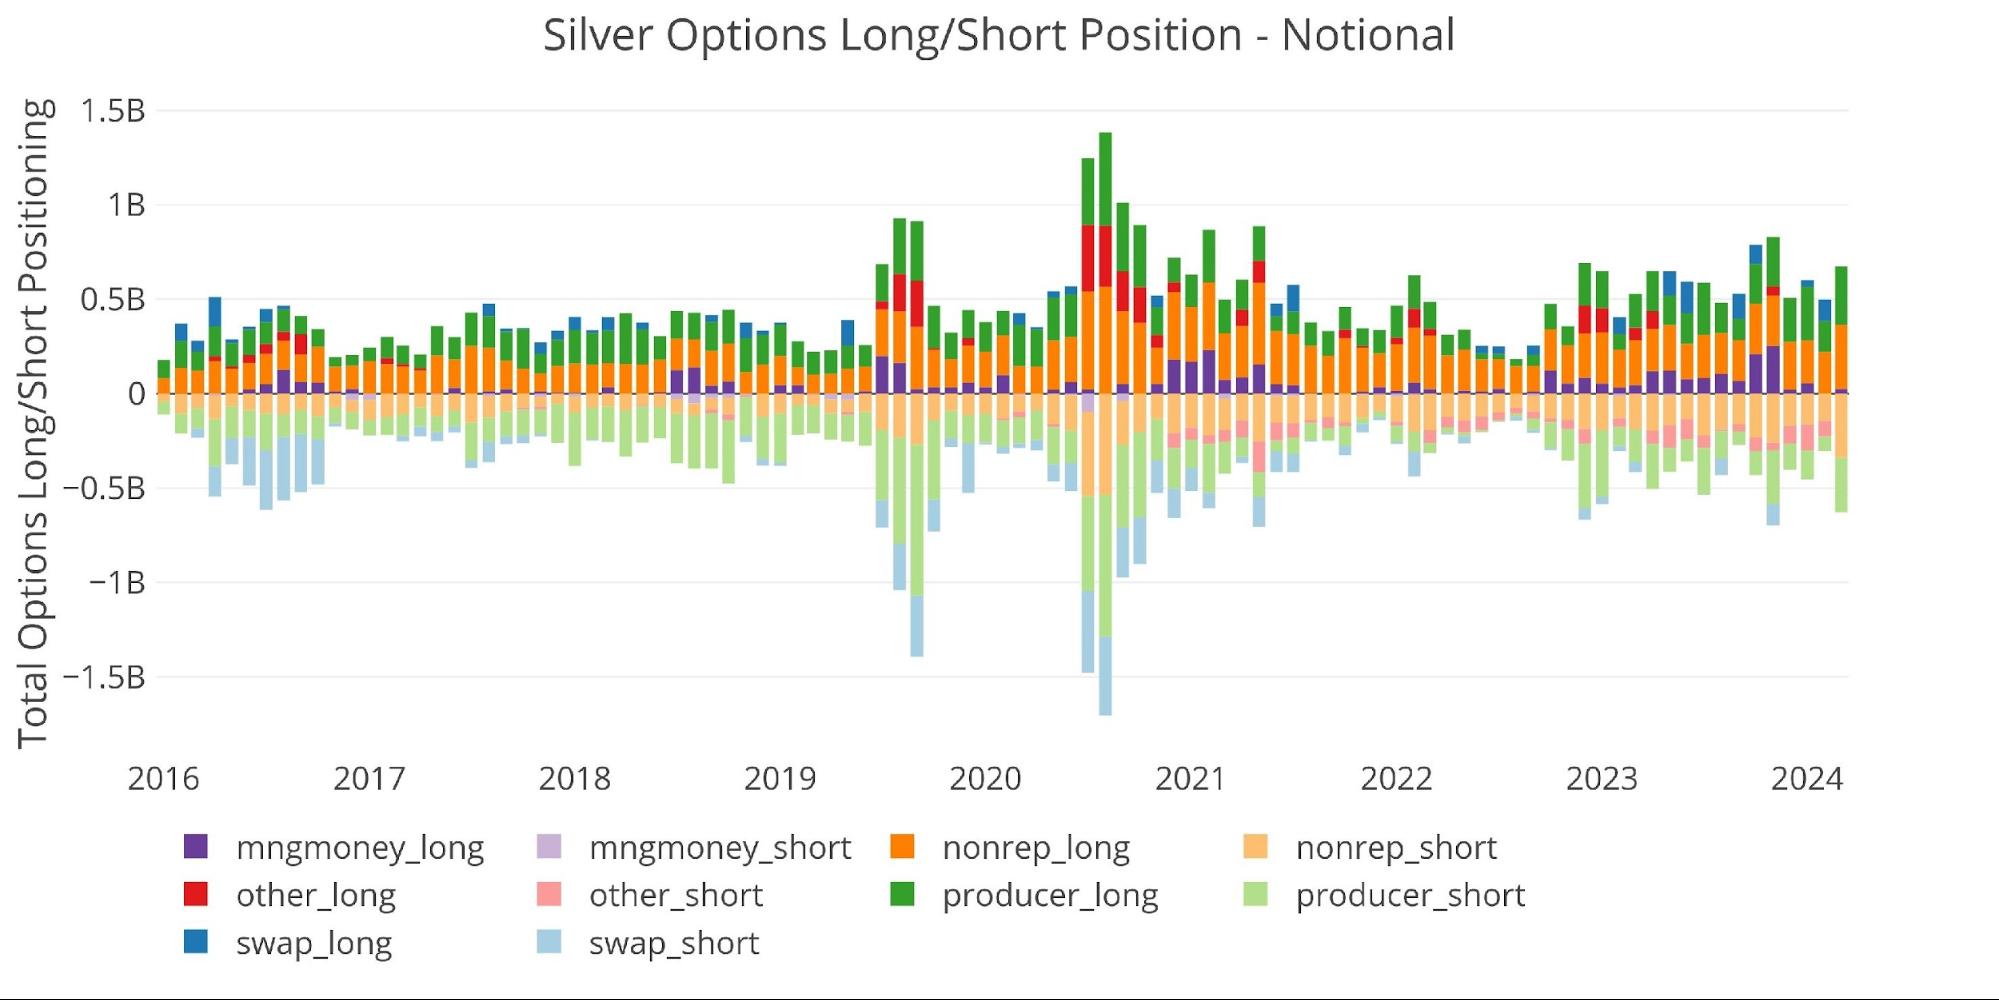
Figure: 8 Options Positions
Conclusion
The table below shows the correlation of price action to positioning for Managed Money and Others (presumably non-institutional). You can see how Managed Money dominates the price action except for 2020. At some point, the price action will not be driven by futures traders, but by physical demand. That is when prices will explode higher as people realize there is not enough gold and silver to go around.
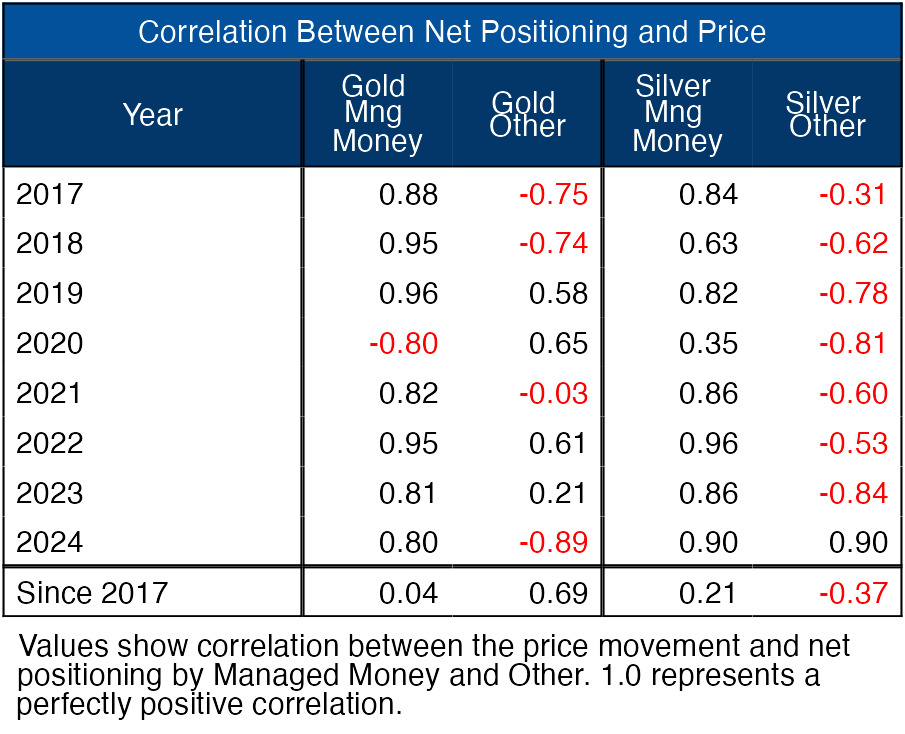
Figure: 9 Correlation Table
No matter how you slice it though, the short-term moves in gold and silver are clearly driven by the futures traders. Over the long term though, the slow and steady price advance in gold is being driven by fundamentals such as central bank buying and physical accumulation.
Data Source: https://www.cftc.gov/MarketReports/CommitmentsofTraders/index.htm
Data Updated: Every Friday at 3:30 PM as of Tuesday
Last Updated: Mar 19, 2024
Gold and Silver interactive charts and graphs can be found on the Exploring Finance dashboard: https://exploringfinance.shinyapps.io/goldsilver/

Call 1-888-GOLD-160 and speak with a Precious Metals Specialist today!
Buka akaun dagangan patuh syariah anda di Weltrade.
Source link