The biggest question now is whether or not the demand will continue to be strong.
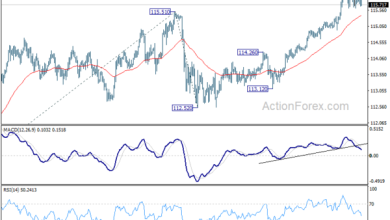
The West Texas Intermediate Crude Oil market initially tried to rally during the trading session on Wednesday but gave back gains as the $100 level has offered far too much in the way of resistance. Looking at this chart, it is obvious that we are sitting on top of the 50 Day EMA, which of course is a significant support level based upon basic technical analysis. In fact, you can almost look at it as a bit of a short-term trendline.

If we do break down below the 50 Day EMA, then it opens up the possibility of a move down to the $90 level. That was an area of support before we took off in a parabolic manner, and now we will have to wait and see whether or not that holds. It is quite ironic, that although the Russian invasion of Ukraine is worse than it was when we took off, oil is about to have made a complete round-trip. Why is this? It has nothing to do with supply. It has a lot more to do with demand.
The biggest question now is whether or not the demand will continue to be strong. After all, the market is going to have to price in the idea of the global economy slowing down, and if that is going to be the case, it is going to have a negative effect on crude oil. That being said, I do not know how much further we go to the downside, and I certainly think that a selloff is probably somewhat limited.
The $85 level should be supportive, based upon the fact that the area has been important more than once. The 200 Day EMA currently sits at the $79.63 level and is rising. I think either one of those should offer a certain amount of support, but I think given enough time we are going to find value hunters. The question is whether or not they are going to show up soon, or whether or not they are going to take the time to get here? Alternately, if we break above the $100 level, then it is likely that we could go higher, perhaps reaching towards the $110 level. It is worth noting also that we are near the 50% Fibonacci retracement level, so that could attract a certain amount of attention as well.

Source link